blog

Chart of the Month: October 2021

October 5, 2021

The Hollow Pendulum: An Examination of Regional Real Estate from 2009-2020

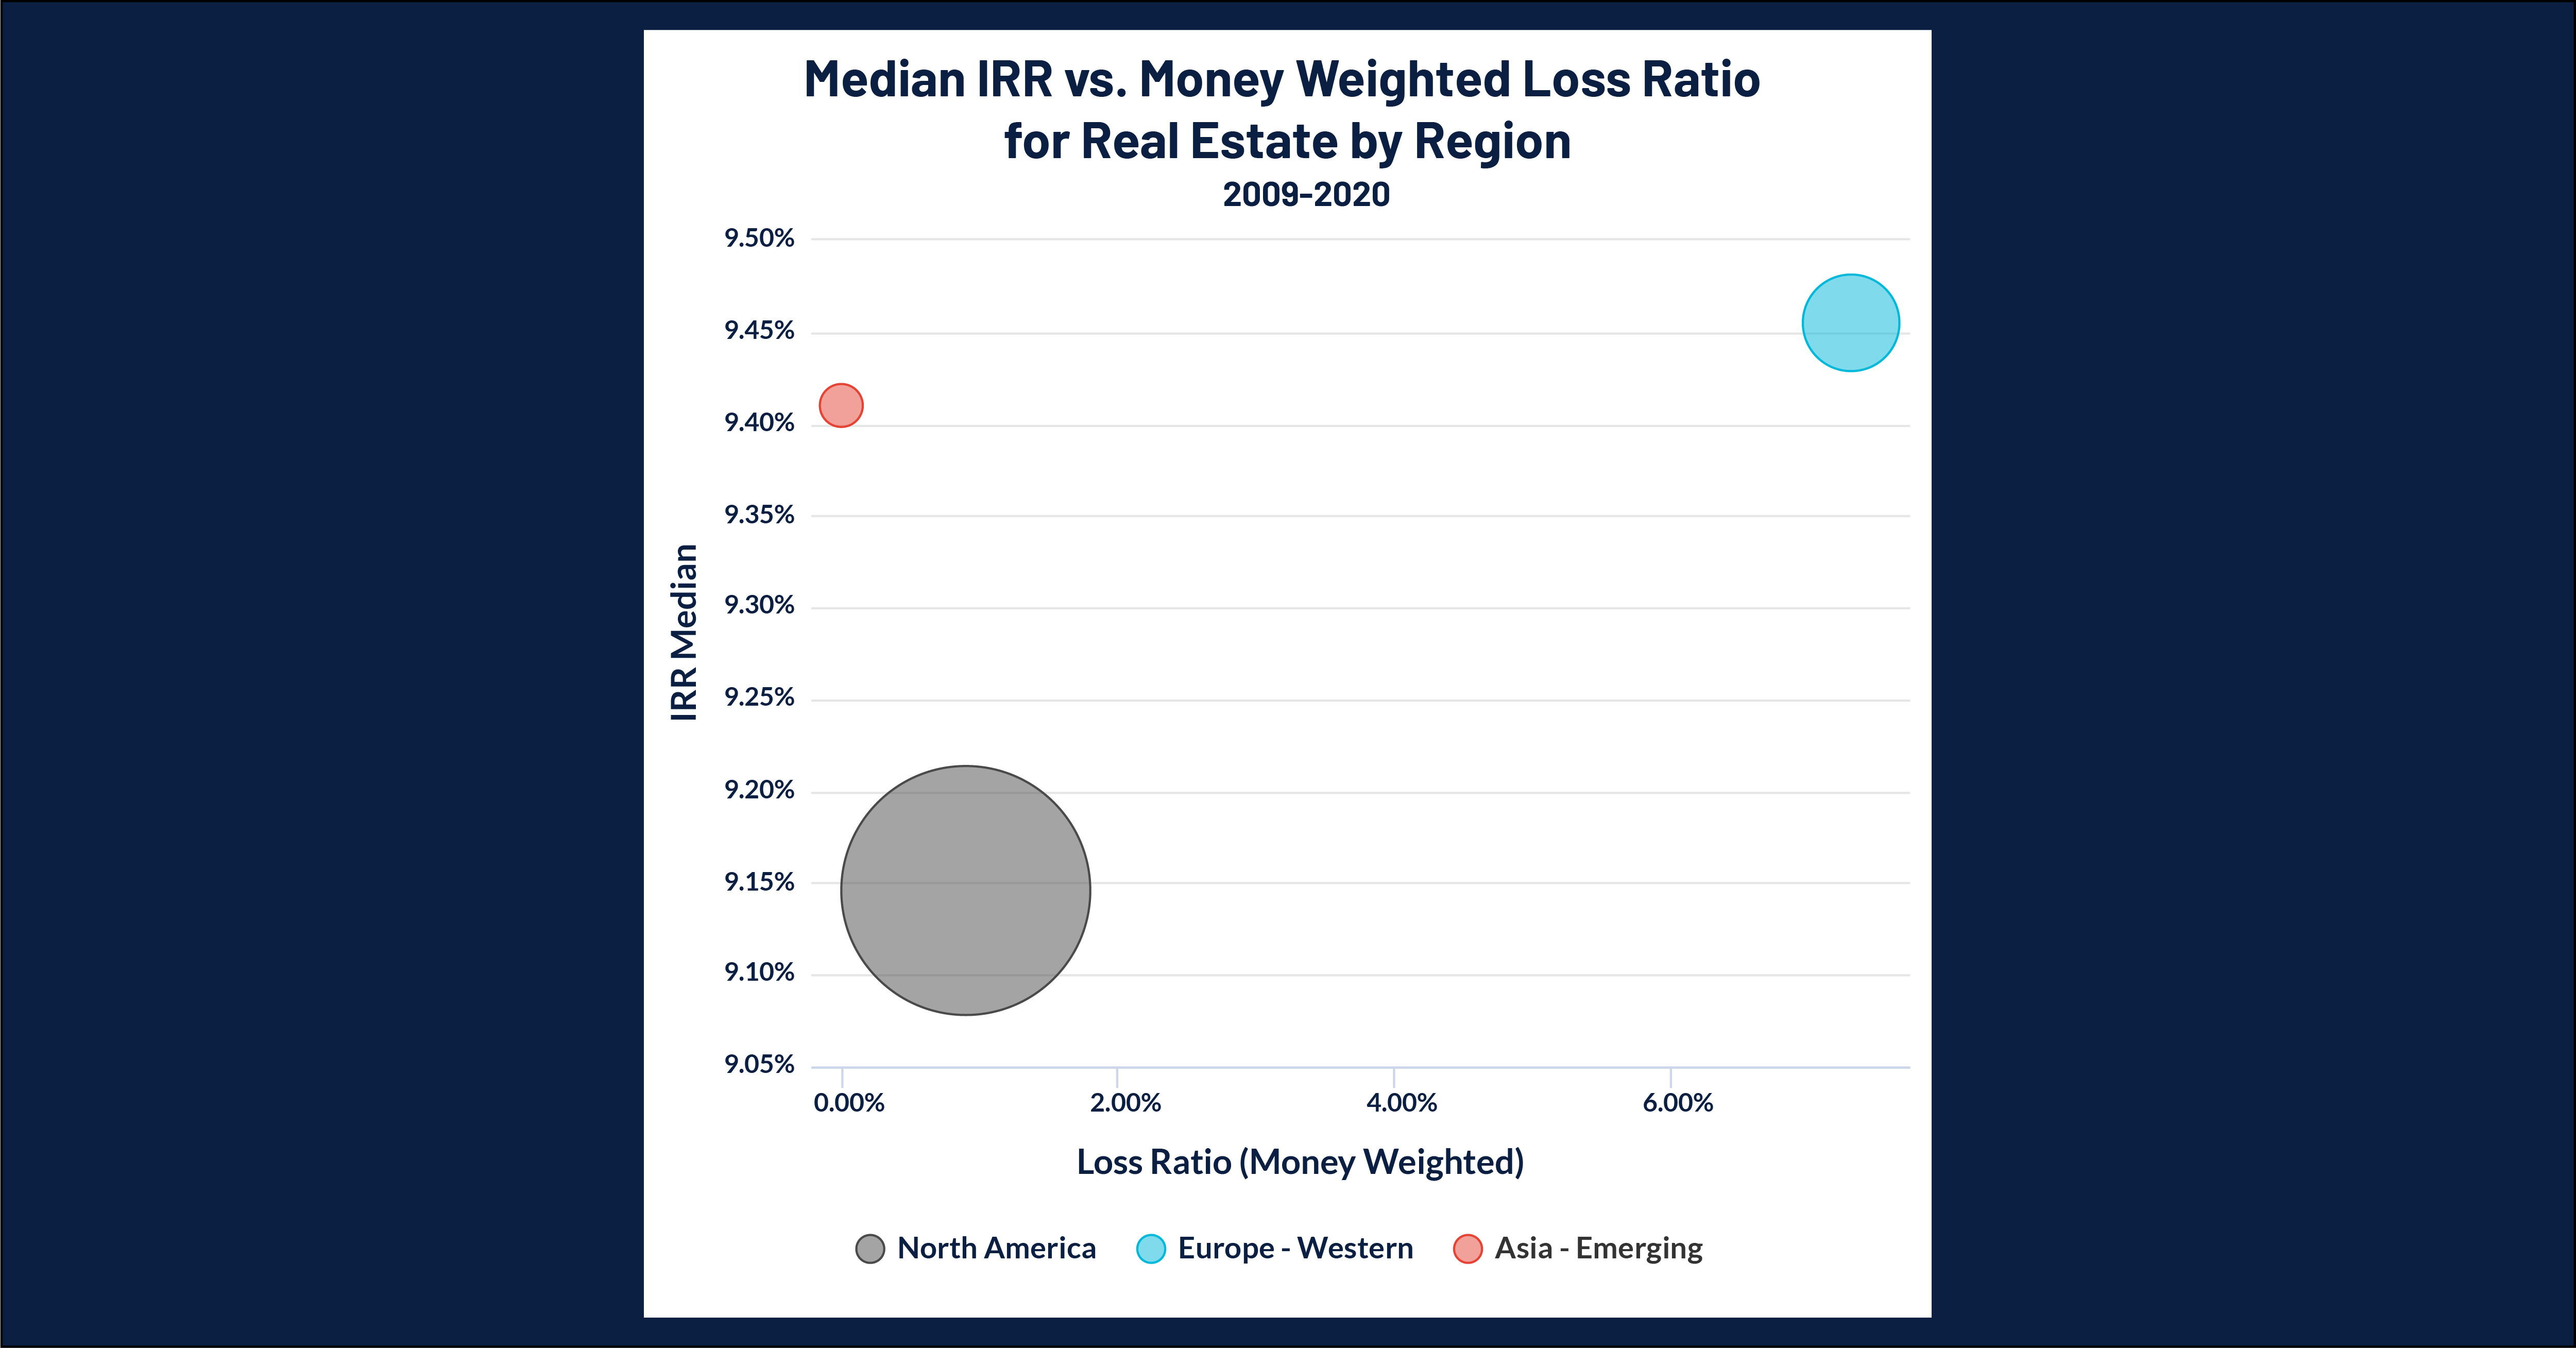
In the wake of the Great Financial Crisis (GFC), there was an incredible buying opportunity that led many private market firms to invest in the highly-distressed real estate sector.  However, recent panics from the Chinese Evergrande crisis raises the question of whether or not the foundations of the recent boom are showing cracks.  As such, this month’s chart analyzes real estate performance since the GFC to see how certain regions performed during the last decade with a focus on the risk taken.  Specifically, we used Cobalt Market Data’s risk/return feature to compare a money weighted loss ratio to estimate risk of loss for a typical fund with a large cap bias.

Key Takeaways:

  • Each of the regions we examined had relatively similar performance, with all three returning a median IRR in the 9-9.5% range. This demonstrates the safety and reliability that real estate has offered through its long-standing and stable appreciation.
  • Risk-wise, we see two groups emerge. The European markets have exhibited much higher risk than the North American investments for nearly the same level of return, likely the result of European areas with stagnant or less reliable real estate markets.
  • The most surprising sector, despite the low sample size, is the emerging Asia real estate. It boasts slightly higher returns than the North American juggernaut with even less apparent risk.  While the higher returns are no surprise for a rapidly-developing region with high investment interest, the shockingly low accompanying risk raises questions over sustainability and completeness of data.  Can this emerging market continue to outperform with little risk of failure, or are we only seeing part of the picture?

Looking Ahead:

  • In light of the recent news out of the Chinese real estate market (the leader in the Emerging Asia sphere), it questions whether we are seeing this outperformance crack and revert back to a more sustainable level.
  • Contrarily, the region’s continued status as “emerging” means that it will continue to attract substantial external and internal investment and could continue to deliver top line performances, perhaps with slightly higher risk allotments.
blog

Chart of the Month: September 2021

August 31, 2021

The Amber Wave: A Look at North American Buyouts Compared to the Russell 3000

Given the volatility of the past year’s returns across the broader markets, we took a wide look at a fundamental point in question: the state of public market vs. private market returns.  We plotted the Russell 3000’s PME against the returns of North American Buyout funds using our in-house PME calculation to see what characteristics each side of the market have demonstrated over the past 20 years.

Key Takeaways:

  • Between the Dot Com bubble and the Great Financial Crisis (GFC) we can see a strong period of outperformance from the private market sample above, routinely outperforming the public market benchmark by 5-10%. This gap shrunk as the GFC approached since public markets tend to see progressively higher performance several years after a recession as public bull markets pull high-capital interest.
  • In the aftermath of the GFC, both markets would remain relatively steady and even. However, after 2012, strong re-investment into private markets would once again push a widening of the performance gap.  Private markets’ long horizons give an ability to invest more heavily into recessions, resulting in a much quicker uptick in performance coming out of recessions than seen in public markets.
  • After 2016, the IRR’s exhibit higher variance than their long term returns on account of the short time that has elapsed since inception. Nevertheless, we can see a continual push towards parity as both public and private returns continued to climb higher in the late 2010’s bull market, feverishly pushing for performance on all fronts.  Private equity’s long-term horizon is responsible for this short term volatility, but a smoothing effect can be seen in a fund’s performance during economic downturns and throughout the full life span of a fund.

Looking Ahead:

  • Notably absent from this examination is the recession of 2020, as the pandemic created sharp but brief drawdowns in public equities. We wait to see if the private market advantage of investing into recessions once again sees a return to dominance.
  • However, the brevity of the 2020 recession and the rapidity of the recovery could allow public markets to close the gap far faster than prior recessions.
  • Given the public/private comparison of bull market run-on strength vs. recessionary opportunity evident in the recent past, it will be interesting to see if these behaviors remain, or if macroeconomic forces alter the standards of outperformance.
blog

Chart of the Month: August 2021

August 2, 2021

If You Build It, Will They Come: An Examination of Infrastructure Fundraising Over the Last Two Decades

With the Infrastructure Bill yet again becoming a top priority on Capitol Hill, we dug into Cobalt Market Data to analyze how the infrastructure landscape has changed within private equity over the past few decades. In the chart below, we’ve taken the total amount raised by all infrastructure funds in our dataset and broken out by vintage years from 2000-2019.


Key Takeaways:

  • The infrastructure sector has seen consistent growth over the past two decades, particularly since the tail-end of the great recession in 2009. The fundraising peak came in 2018, totaling over $104 billion. This growth follows the overall uptrend of money into private equity and can also be tied to institutional investors carving out a larger allocation of their portfolio for infrastructure and real assets.
  • There has also been a shift in the structure of the funds being raised; the total number of funds raised actually peaked in 2013 and 2014 as the dollar amount raised continued to rise throughout the rest of the decade. This shift is reflected in the average amount raised for each fund by vintage year, which has been above $1 billion for every year since 2015, peaking in 2017 at nearly $1.8 billion.
  • A contributing factor here may be the rise of mega-funds within infrastructure, with all 10 of the highest-raising funds in the sector growing since 2015. This shows that while the overall pool of funds is growing, larger totals are being concentrated into the big players in the space that have the resources to raise 11-figure funds.

Looking Ahead:

  • The next few years in infrastructure investing may depend on the decisions made in D.C., but based off of our analysis there also seems to be plenty of momentum for growing capital in the infrastructure space regardless of outside forces.
  • It will be interesting to see if the concentration of these mega funds continue, with the larger players raising even larger funds, rather than the swell of new firms in the space being the driving force behind growing amounts of capital being raised.

blog

Chart of the Month: July 2021

July 2, 2021

The Tortoise and the Hare: An Examination of the Two Styles Driving Healthcare and Tech Investing

This month, we examined institutional interest in the Healthcare & Technology sectors from 1990 to 2019. We used Cobalt Market Data to break out our Limited Partner investments into these sectors by investment style in order to see the trends that emerge within each specific style.

Key Takeaways:

  • Though there seems to be cyclical interest in these sector-specific investments, the general trend is upward, illustrated by the 3-year average total investments per year of the main peaks (most evident in the VC trendline) over the past 20 years: 1999-2001; 272 Investments / year, 2006-2008; 351, 2014-2016; 465. This shows that institutions are impacted by external market factors that may cause the cyclical demand, but overall, the appetite for sector-specific funds has been growing since the turn of the century.
  • Interestingly, 2019 was the first vintage year in which sector-specific buyout funds surpassed venture funds in total investments since the early 90’s, when total investments in these funds was significantly lower. We also can observe that Buyouts have been steadily growing since the early 2000’s, while venture tends to react more cyclically around greater market events such as the Dot Com Bubble and Great Recession.
  • Two factors may be working in tandem to cause this uptrend. First, institutions may be turning more to sector-specific funds as an attractive tool for portfolio diversification, creating demand for more investments in the space. On the other side, Buyout firms are raising more sector-specific funds or starting out as sector-specific shops as another way to differentiate and create competitive outperformance in the overall buyout space. With more capital invested in the space and more landing spots for that capital, the steady rise in the buyout space over the past two decades begins to make sense.

Looking Ahead

  • Strictly based off of the historical chart pattern, Venture Capital investments look ready to reverse trend and approach the highs seen in 2000, 2007, and 2015 again. As well, the macro event of the pandemic last year may be the catalyst for higher venture investments, as healthcare will be a popular space in the coming half-decade.
  • Based off of past market events, this may have a more muted effect on buyouts, but we would still expect these funds to benefit as well and continue their uptrend that has been especially strong since 2010.
blog

Chart of the Month: June 2021

June 3, 2021

Ventured, Gained? How Geography Has Impacted Venture Capital Efforts

This month, we used Cobalt Market Data to take a step back to see how a fund’s geographic region shapes performance and specifically, how this impacts the performance of venture capital funds.  As such, we examined the relationship between IRR dispersion and Geography in North America, Western Europe, Emerging Asia, and MENA since 2010.

Key Takeaways:

  • As most would expect, North America boasts a fairly strong record of return here. The region demonstrates reasonably high variation in its first and fourth quartiles while the second and third quartiles are fairly tight. This indicates a “feast or famine” style, where the winners win big, and the losers lose just as big. Meanwhile, the safer funds earn a consistent, albeit conservative return. Undoubtedly North America is one of the hottest areas for venture investment and crowded American markets such as Silicon Valley have pushed some firms to pursue riskier investments to maintain upper-level returns and stay competitive.
  • By contrast, Western Europe Venture Capital has had a far rougher time. Europe’s dispersion features the lowest upper and lower quartiles, and the lowest median return of approximately 0%. Their fourth quartile is also by far the lowest and widest of any region, giving a great deal of pause to any venture-curious investor. This come as little surprise to most as the European market (public and otherwise) has been stagnant for most of the past decade, only recently showing an uptick in interest amidst highly-priced American assets.
  • Our most surprising discovery was the performance of the MENA (Middle East and North Africa) region. This area’s past decade has delivered stellar Venture Capital performance across the board with the highest top and bottom quartile, and fairly thin quartile dispersion, indicating higher floors on the funds that do lose.  This may represent the region’s cross-section of favorable age demographics with fairly high available capital.

Looking Ahead

  • Given the long-standing dominance (and high valuation) of American assets, there has long been predicted a shift away from them to other regions. While the entrepreneurial and investing infrastructures may not be fully prepared in all regions, and though the American regime seems far from over, this chart indicates that other areas are ready to accept venture capital investments in the near future.
  • Despite lower historical performance in areas like Europe and Emerging Markets, there is clearly venture interest in those regions, and with the progressive crowding of American markets, these regions could see inflows and upswings in performance over the next decade.
  • And what of letting winners ride? It would be very surprising to see interest die out in a region such as MENA now that it has proved to be receptive and profitable. This will encourage far more investor interest, further building venture networks in the region and producing dominant outcomes.
blog

Cobalt Chart of the Month: May 2021

April 30, 2021

Outpacing the Rising Tide: An Examination of the 2015 Distressed Credit Crash

As evidence of inflation and concerns over future yields amidst the economy recovery have begun to emerge, we used Cobalt Market Data to look at an example of yield-driven frenzy that built in the wake of the last recession.  We examined the distressed credit bubble on the mid 2010’s and the impact on fundraising efforts from 2002 until 2020.

Key Takeaways:

  • 2015 was a tumultuous year for distressed debt investors. Distressed credit vehicles achieved a record fundraising year of $29 billion, exceeding fundraising efforts in 2007, the previous all-time high vintage year, by $7 billion. The distressed debt frenzy of 2015 followed years of very low interest rates in a correction effort to quell the effects of the recession.
  • The movement to distressed debt became strong in 2013, with traditional investments in 2012 trailing expectations. Investors looking for high-risk, high-reward investments in 2015 and the two years before were turning to distressed debt vehicles of all kinds, including mutual funds and hedge funds that were placing bets on risky junk bonds and credit held by companies facing impending bankruptcy.
  • Because of the illiquidity of high yield debt, sliding commodity prices, and high corporate debt default rates, the high yield investment funds began to experience mass capital recalls from investors. Total fundraising for these funds went from about $29 billion to $10 billion and under for the years 2016-2018, until 2019. 2019 distressed debt funds followed a very similar pattern to 2007 funds, raising approximately $20 billion. The crash of distressed debt vehicles coincided with the slowdown of the US economy, which had grown 3.9% in the second quarter of 2015, but only 0.7% in the fourth quarter.

Looking Ahead

  • The federal reserve is expecting GDP growth and strong economic conditions in the coming future but has not yet raised interest rates. Inflation is expected to rise, pushing up the yields on the 10-year treasury note quite rapidly, mirroring patterns in yield raises experienced after the 2008 recession.
  • Today, the near-zero interest rates, rising inflation, and the backlash of rising treasury yields may create a similar circumstance to the distressed debt frenzy in 2015. The distressed debt market experiences long, multi-year cycles that correlate with economic prosperity. It will be interesting to see if investors in 5 years will look to more volatile, risky investments to produce returns that could not be achieved in the stock market. These  economic factors could indicate the plateau and recession of high growth high yield stocks, pushing investors into low-risk investments with slow and steady returns.
  • On the other end, investors in 2015 and the two previous years learned the hard way that these investments can be very illiquid, and returns may disappear before principle or interest are returned to the investors. With the rise of crypto trading and other unorthodox yet potentially lucrative investing, investors may flock to these new opportunities to beat lagging market returns.
blog

Cobalt Chart of the Month: April 2021

April 1, 2021

Resource of a Different Color: Trends and Differences Among Private Market Styles in 2020

With the end of Q1 marking the one-year anniversary of the bottom of the drop across all markets due to COVID-19, we used Cobalt Market Data to look at the performance of the private markets in the lead up to Q1 2020 and the following bounce-back quarter. For this analysis, we’re looking at the time-weighted rate of return by investment style and have selected four styles to be indicative of the market in general: buyout, credit, natural resources, and venture capital.

Key Takeaways:

  • All markets across private equity followed the public market trend, with all of the selected investment styles experiencing declines of at least 9% from Q4 2019 to Q1 2020. All returns went negative, as asset classes across the board were unable to avoid the shock of COVID-19.
  • In particular, natural resources saw the greatest impact, declining from -3.3% in Q4 2019 to -20.3% in Q1 2020. Natural Resources had underperformed the greater PE markets during the preceding year, and the chasm was accentuated in March of last year. This precipitous drop likely stems from the demand shock on energy and fuel as global travel grinded to a halt, punctuated by oil futures going negative a month later in April 2020.
  • Buyout, credit, and venture capital saw proportionate pullbacks, however these were moderate when compared with the exorbitant decline in natural resources. A likely explanation for this is that these three styles offer diversification among sectors which helped to somewhat soften the blow, while natural resources are largely tied to the energy sector and its performance.

Looking Ahead

  • The recovery in the private markets was swift, with each style above posting positive returns the following quarter. This is in line with the greater financial market recovery, even as the economy lagged throughout the rest of 2020.
  • It will be interesting to see if natural resources stay tethered to the performance of the energy markets. We have seen energy perform well in the public markets in the 1st quarter of 2021, while the tech-driven rally through 2020 began to slow. As the economy further re-opens, we’ll see how other natural resource sectors such as timber and mining fare as the economy works its way back to normalcy.
  • A sub-sector to watch within natural resources is the renewable energy space. Renewable energy and climate solutions have become a focal point of the new administration, and energy-focused ETFs experienced their highest investment levels in over a decade. It will be interesting to see what the impact of this trend is on the energy sector and the private funds focused on it are in the coming decade.
blog

Cobalt Chart of the Month: March 2021

March 4, 2021

Mind the Gap: A Decade of Emergence in the Emerging Markets

This month, we wanted to look at a perennially under-examined sector (the emerging markets) to see how investors have behaved in the calms and crises of recent memory.  As such, we used Cobalt Market Data to examine the relationship between Net Asset Value and Dry Powder in Emerging Market funds from 2010 to 2020.

Key Takeaways:

  • Since 2009, emerging market funding has increased from about $5 billion to a peak of approximately $85 billion in 2019. This 11-year increase is attributable to expanding private equity investment opportunities and a less saturated deal sourcing environment than in the North American and European developed markets.
  • The influx of funding from 2007 to 2009 led to a substantial increase in fund values leading into Q3 of 2010, where the returns of emerging market funds surpassed the dry powder in the market, a lead that it has not relinquished since. This trend of higher NAV’s in relation to dry powder funding parallels the overall private equity market.
  • The NAV of these emerging market funds exceeded the dry powder funding by a little under 20 billion in 2017, and by Q3 of 2020 it has increased to almost an $100 billion gap, attributable to a strong emerging market investment landscape in 2016 and 2017. This gap was further exacerbated by the 2020 pandemic drawdowns, leading to significant dry powder usage on the newly cheaper assets.

Looking Ahead

  • Though a pullback may be expected for these funds due to the latest recession, Emerging Asian countries like Malaysia are becoming increasingly efficient exporters. Additionally, the migration of insurance companies and other financial institutions to these developing economies (as well as a weak US dollar spurring easier loan payments from emerging market countries with dollar-denominated debt) will bolster the rapid economic expansion of these nations.
  • In the event of a short-term pullback, we could expect fund NAVs to decrease to reflect the economic recession experienced in 2020 by emerging economies. Funds invested in EM companies would feel the effect of disrupted supply chains, commodity exposure, and reduced domestic economic activity on their domestic demand and export capacity.
  • During the upcoming expansionary period, as investors seek growth opportunities for market-beating returns, we would expect dry powder for EM funds to increase. The gap between NAV and Dry Powder would likely decrease in the short term, but in the long run, as we see the MSCI Emerging markets index beat out the S&P 500 for the first time in 3 years, it is clear that public and private market confidence in high growth EM companies exists, and could easily recover once global economic uncertainty decreases.
blog

Cobalt Chart of the Month: February 2021

February 4, 2021

Cobalt Market Data / Chart of the Month

After looking at the performance of follow-on investments back in October, we wanted to examine how some of those follow-on funds have behaved since the last recession to gauge how they may respond to the tumult of 2020.

In our examination below we looked at all secondary funds since 2007 and broke it down by percent of the NAV that was paid out each quarter.

Cyclicality in the Secondaries Distributions

Key Takeaways:

  • More than most styles, secondaries follow a cyclical pattern of distributions. Starting in 2008, distribution pace peaked and then hit a trough the next year before building to another peak within two years. This cycle has been the dominant trend since the financial crisis, which could be due to a large number of successful funds in 2007-2008 leading to above average distributions 3-4 years later, coinciding with the next fundraise of those fund families, creating some vintage concentration.
  • In the past two years, we have seen a cessation of this trend as the pace has been constant since the 2017 peak and the overall oscillation has been dampening. This is likely due to both the lack of distributions for funds in the last three years (as they have not necessarily matured), as well as the fund concentration and abnormal performance factors diminishing over time as new funds enter the market.

Looking Ahead

  • As 2020 has created drastic shifts in demand and revenue, historical funds will see much higher volatility in their NAVs. For those firms gaining business during the pandemic. this could cause a spike in distribution pace. For those hit hard, value conservation could produce a sharp drop in distributions. Despite the uncertainty these demand forces have brought, the distribution rate for 2020 is roughly on pace with the past 2 years through June 30th.
  • Since this cyclical regime of the 2010’s coincided with a recession, it could be that the depressed prices seen in last year will create a similar profitable fund concentration and thus another distribution spike in 2023-2024.
blog

Cobalt Chart of the Month: January 2021

January 8, 2021

Cobalt Market Data / Chart of the Month

2020 is in the books and closes one of the crazier years for the global financial markets in recent history. We saw eye-popping returns in many different asset classes throughout the post-March rally. The start of the new year means time for New Year’s Resolutions, and for private equity funds that means generating superior returns. In that spirit, we wanted to understand the trends of superior-performing funds in private equity in the past to see how the number of funds with exceptional IRRs has grown over time.

In our analysis, we will be working with the Cobalt dataset from 1995-2015, including all funds with performance greater than 26%, as seen in the chart below. The past 5 vintage years have been excluded from the analysis due to high-variance IRRs early in a fund’s cycle.

New Year’s Resolutions:
Trends in the Top-Performing Private Equity Funds

Key Takeaways:

  • Early in the analysis, we see a more cyclical pattern of top-performing funds, with a steady increase through the late 90’s, followed by 5 consecutive years of decline in the 2000’s. This decline roughly tracks with the dot-com bubble in the public markets, leading to a collapse in demand and decline in top level performers throughout the next 5 years.
  • Post-2009, we see a steadier trend of year-over-year increases. While the 2015 surge may regress as funds mature, and may still mark a new all-time high for funds meeting this threshold, It seems likely the upward trend will continue into the latter half of the 2010’s. Moreover, the healthy economy experienced in the latter half of the decade created a good environment for these numbers to sustain, as seen in previous cycles.
  • As the bar for top performers continues to rise, there will be a greater level of competition in the market to reach these thresholds, benefitting firms and investors alike; A larger pool of funds presumably means more firms performing well and more institutional investors reaping the benefits of this performance. We have also seen the drive for superior returns reach new heights once again resulting in trends such as the IPO and SPAC frenzy, as well as continued redoubling towards traditional private equity. This leaves investors with a diversity of avenues to achieve returns, and promising firms able to achieve the best investment terms as GPs compete to fund them.

Looking Ahead

  • Private Equity has long been seen as a way to create superior returns in a portfolio, and we’ve seen a growing number of funds join the elite class this past decade.
  • The changes that 2020 brought to the financial landscape will be an interesting test to this growing trend, and we’ll be looking for what these implications have for the upper end of the private markets.