Chart of the Month: April 2024
Surge Pricing: Examining the Ability to Adjust North America Infrastructure Investing on a Short Timeline
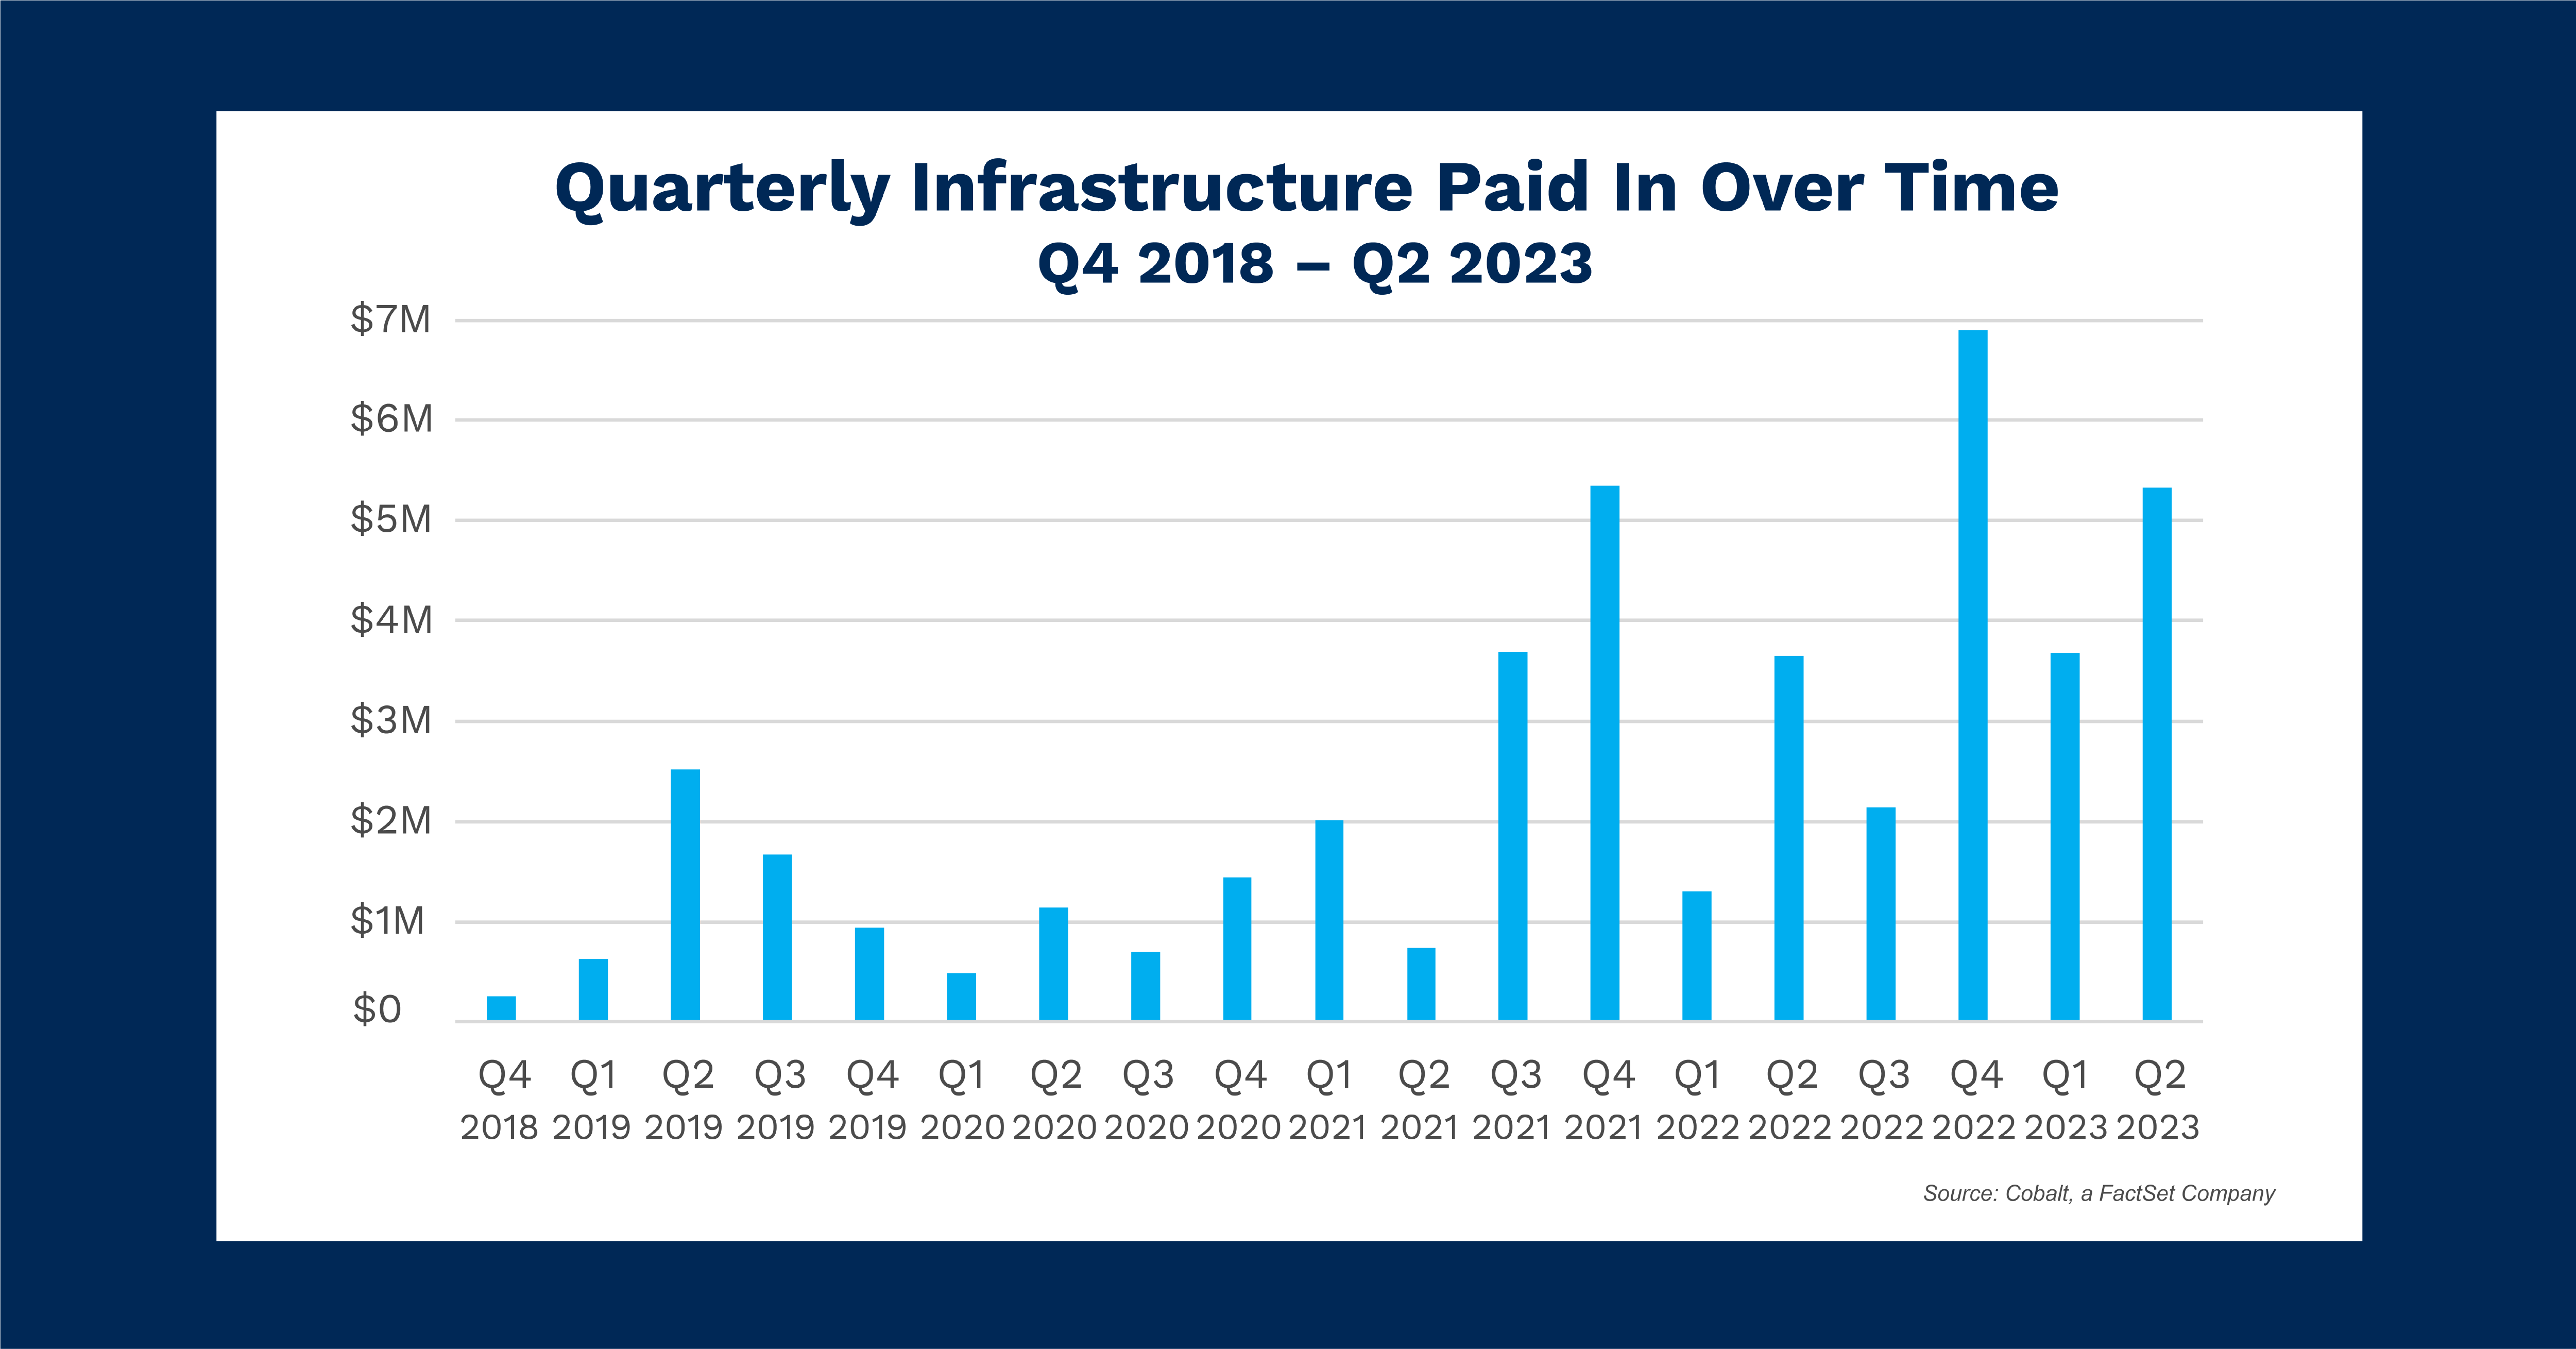
The state of Infrastructure investing in America has been an often-criticized topic. In addition to wear and tear, sudden and catastrophic damage is a real danger to both the logistical integrity of our economy, and the lives of those who need to use these facilities every day. While we often look at infrastructure investing, considering recent sudden damage such as the Francis Scott Key bridge collapse, or the elevated hurricane levels predicted for this year’s Atlantic coastline, this time we wanted to look at the investors’ potential impulse contribution level: how fast investment could shift at a private level to respond to demands for greater infrastructure investing. The next few months we will be testing out expanding beyond our in-app Cobalt Analytics to leverage the dataset capabilities out of the platform. As such, we put together a portfolio of North America Infrastructure funds and exported the data to create the above visualization. The goal is to see how flexible investment contributions have been over the past 5 years on a quarterly basis.
Key Takeaways
Looking back to the beginning of our charts, we see a low sustained level of contribution: hovering between $1B and $2B per quarter. The primary driver of growth quarter over quarter is clearly coming from LP investment. This is a strong rate of investment, with usually positive NAV growth statistics contributing to slow and steady expansion over time. This market clearly accommodates noise with its fluctuations in contribution levels but seems to mean revert and hold a steady state rate of investment.
This changes as we move forward in the chart. Looking to Q3 2021, we see a rapid increase in investment level, with no clear new mean level of support. The timing here coincides with the passage of the Infrastructure Investment and Jobs Act, thus either leading to a rapid expansion in infrastructure investment interest, or an expansion in the universe of infrastructure investment opportunities. Regardless, assuming this trend is a going concern, the result is that available funding for infrastructure has expanded as is flexibly investible on a quarterly basis: able to go up one quarter, and down the next.
Looking Ahead
Given the greater investment capacity of the last few years, there is a good chance that the capacity for a surge of investing towards infrastructure needs does exist. The main holdup would be the investor appetite for immediate change, and whether projected returns on such short-term scoping can sufficiently attract these surges to keep pace as America’s need for further infrastructure investing increases.
Subscribe to our blog:

Is There Geographic Bias in Macro Liquidity Trends in Private Markets?
Is There Geographic Bias in Macro Liquidity Trends in Private Markets? Building on our previous analysis of the role of…

Private Equity Performance: Large Strategies Versus Funds of Funds, Co-Investments, and Secondaries
Private Equity Performance: Large Strategies Versus Funds of Funds, Co-Investments, and Secondaries In private equity, the large strategies of buyouts,…

Examining Tariff Policy Impacts on Private Fund Contribution Rates
Examining Tariff Policy Impacts on Private Fund Contribution Rates Recently we examined the impact of Latin America presidential elections—which carry presumptions…