Next-Level Portfolio Monitoring
Welcome to connected, flowing data, advanced analytics, and on-demand reporting. Personalized for every user.
our process
How we deliver self-service portfolio monitoring
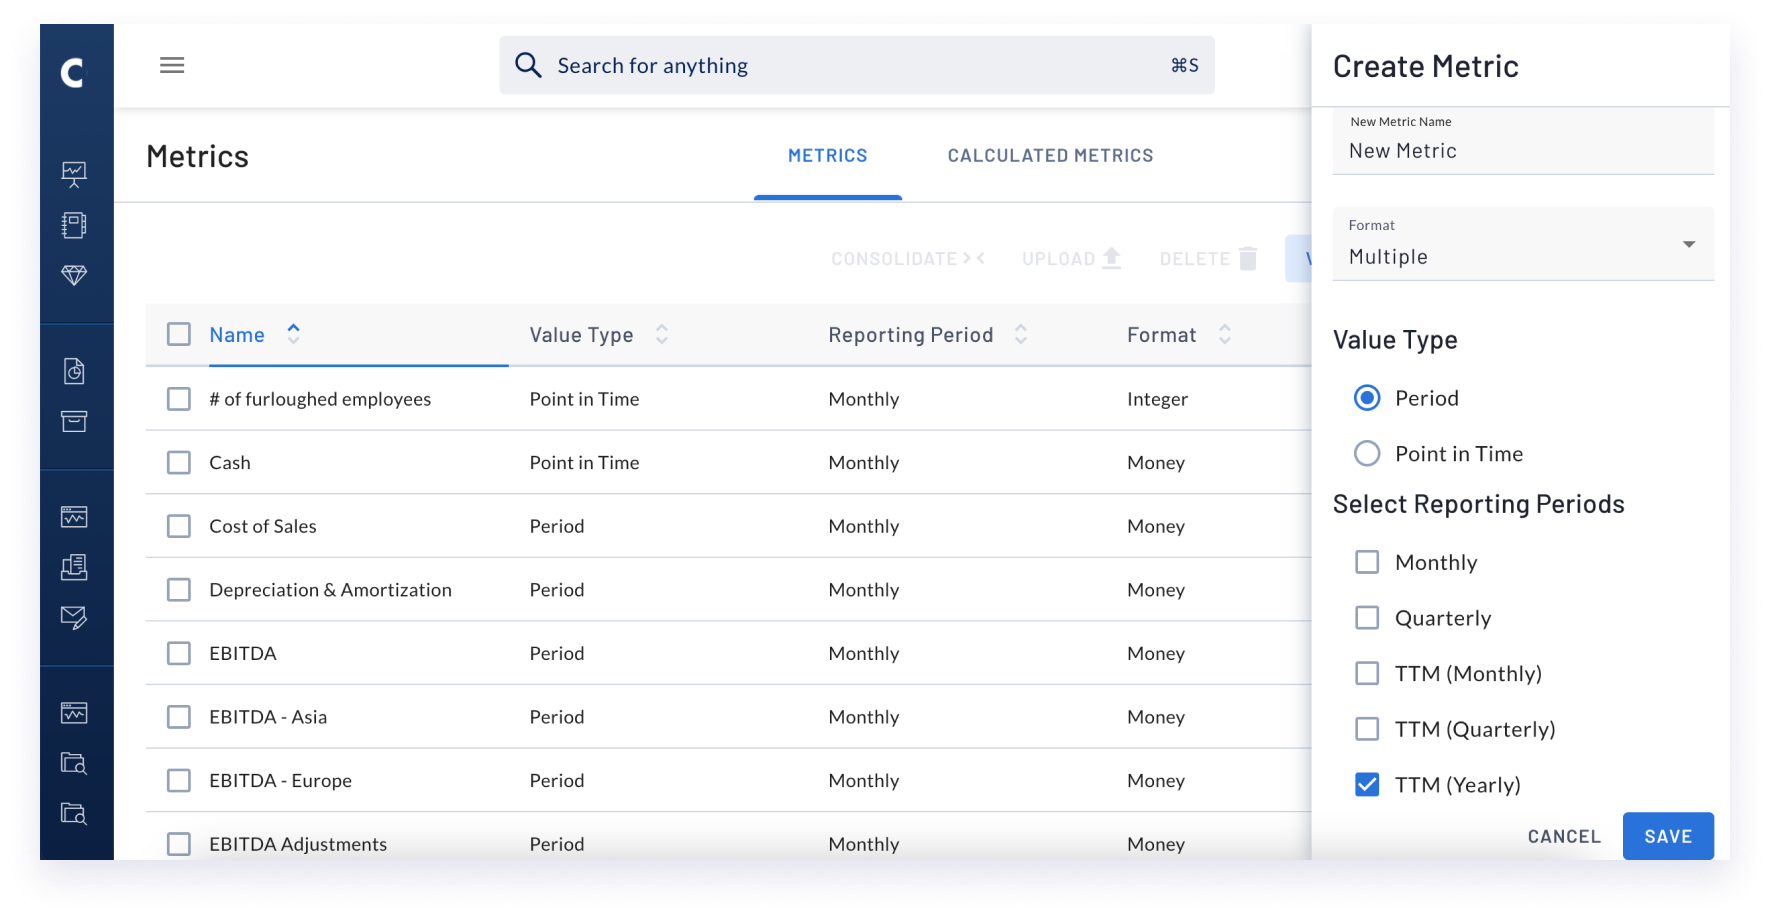
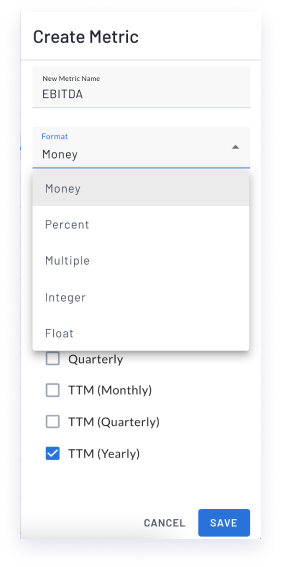
Custom Metrics & KPI Tracking
It all starts with good data. Whether you are creating new metrics, or updating your numbers, Cobalt provides total flexibility to track the metrics and KPIs relevant to each of your investments:
Flexible Data Collection Options
Some call it “data ingestion.” The rest of us call it getting your portfolio company data and fund metrics in a central database to serve as a single source of truth for your firm.
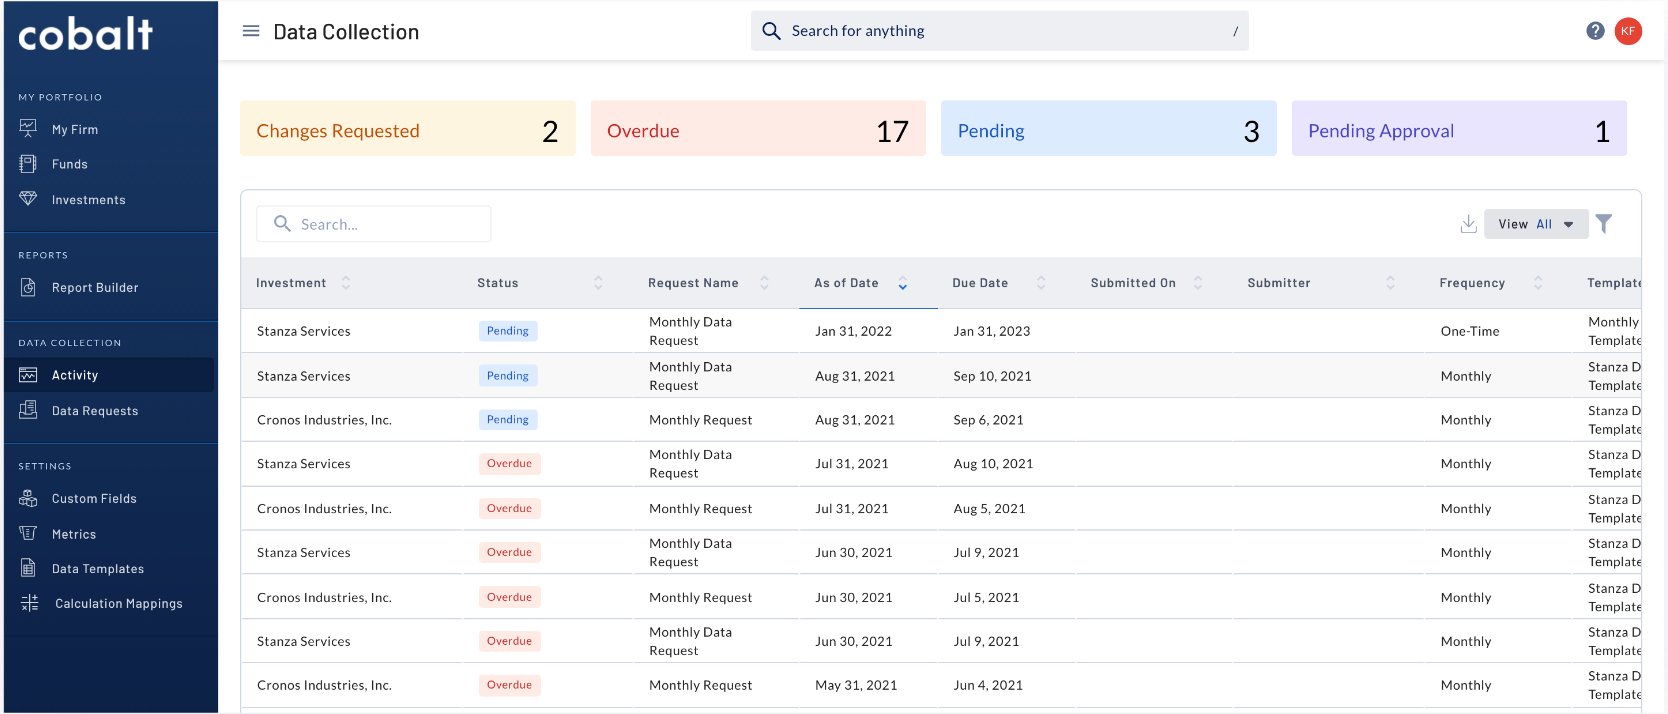
Cobalt removes the labor-intensive pain of the
data collection process through:
Dashboards, Reporting, and Advanced Analytics
From quarterly reporting to ad hoc analysis, Cobalt serves up your performance data the way you need. Translation: no more logging between cumbersome Excel spreadsheet or creating complex pivot tables to get the job done.

- Critical cash flow calculations
- Cross-Portfolio Analysis
- Peer Analysis
- Scenario Modeling
- PME Benchmarking
- Value Concentration Analysis
- Deal Scoring Analytics
Here’s what Cobalt offers
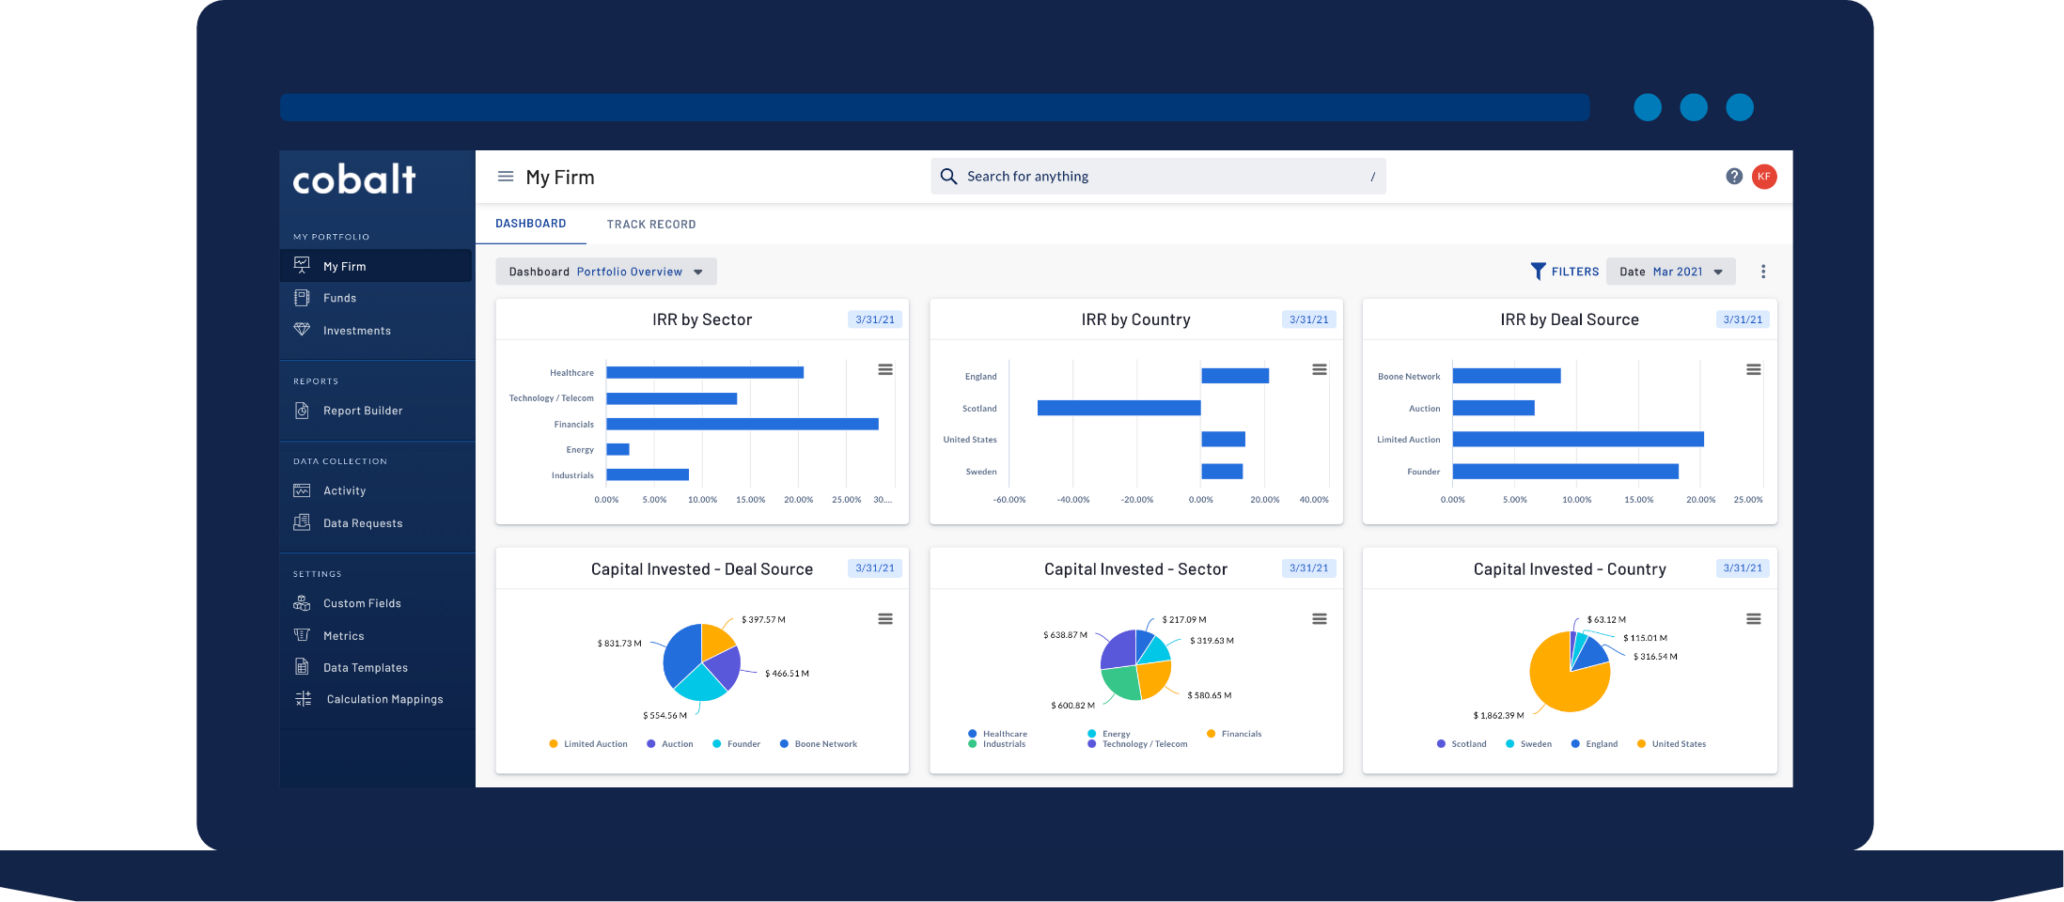
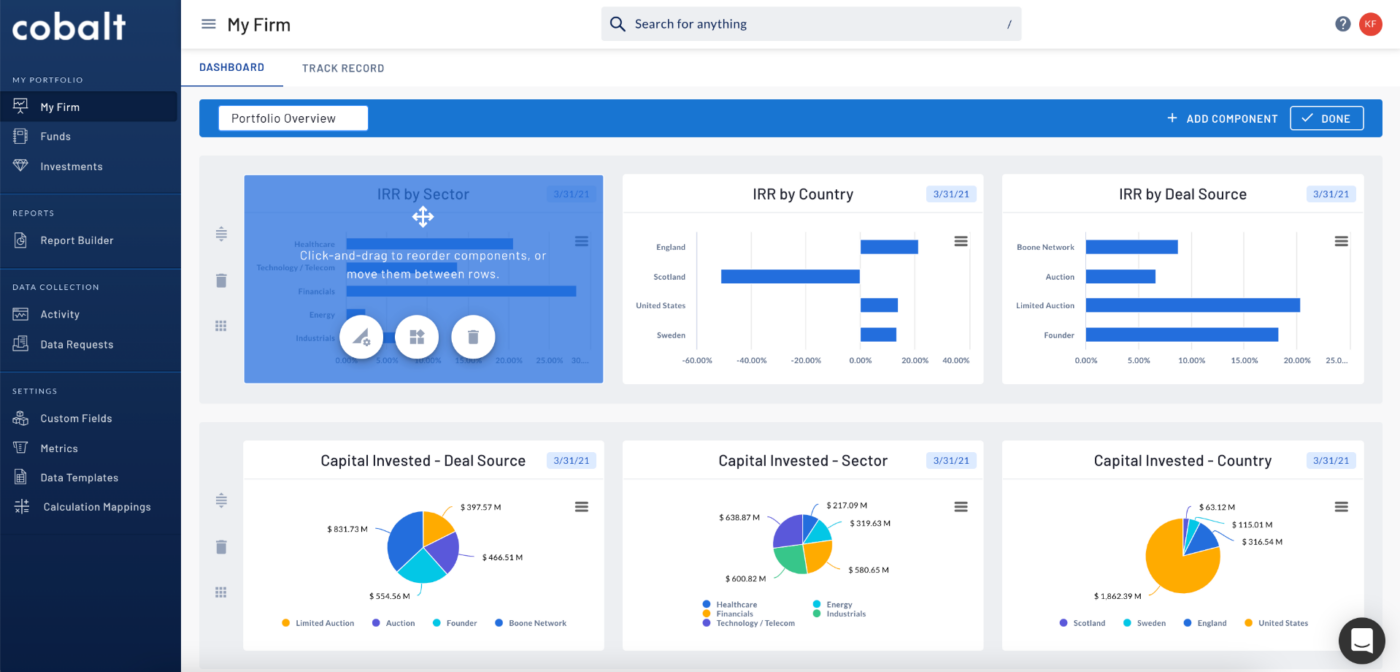
Personalized Dashboards
- Transform data into actionable insights for finance, investment, portfolio operations, investor relations, and executive management team members.
- Drag and Drop components to create custom dashboard views that match your firm’s unique reporting needs.
- Visualize all the data most important to your role instantly upon log-in.

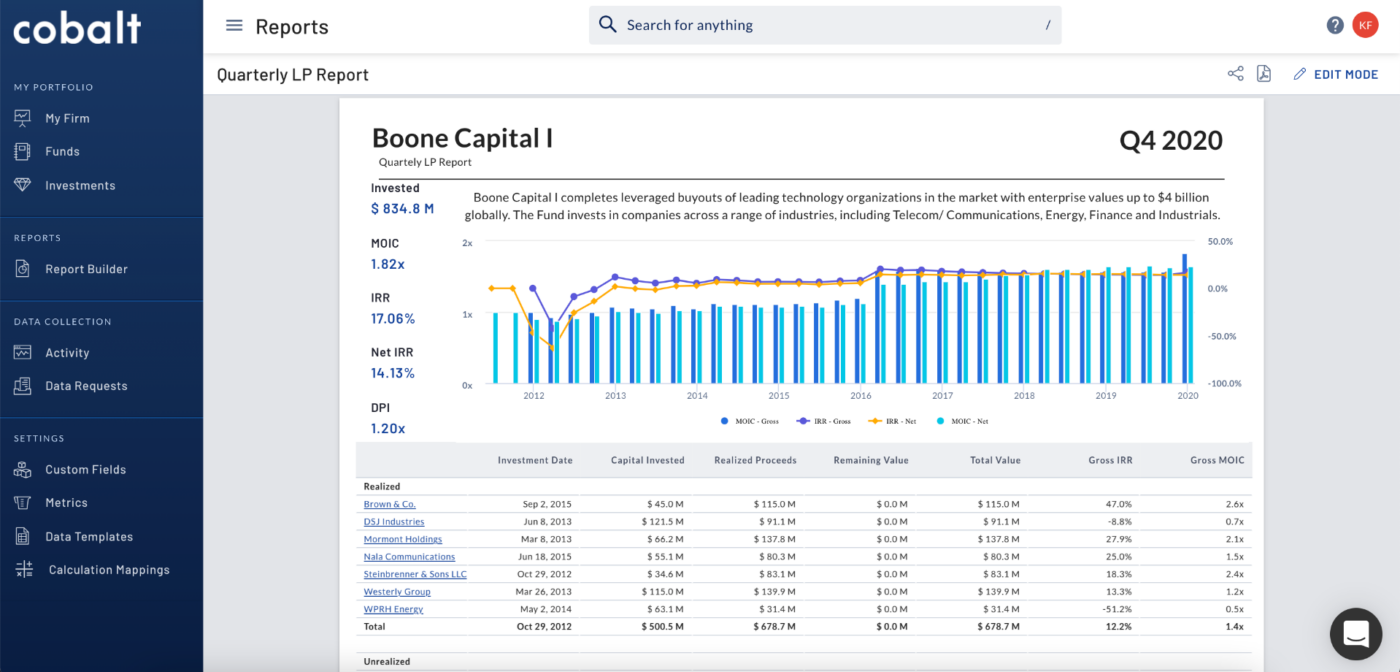
On-Demand Reporting
- Craft custom reports with Cobalt’s intuitive reporting technology that aggregates fund performance plus portfolio analytics.
- View reports online and share access with internal teams or partners.
- Export reports for distribution the way you need.
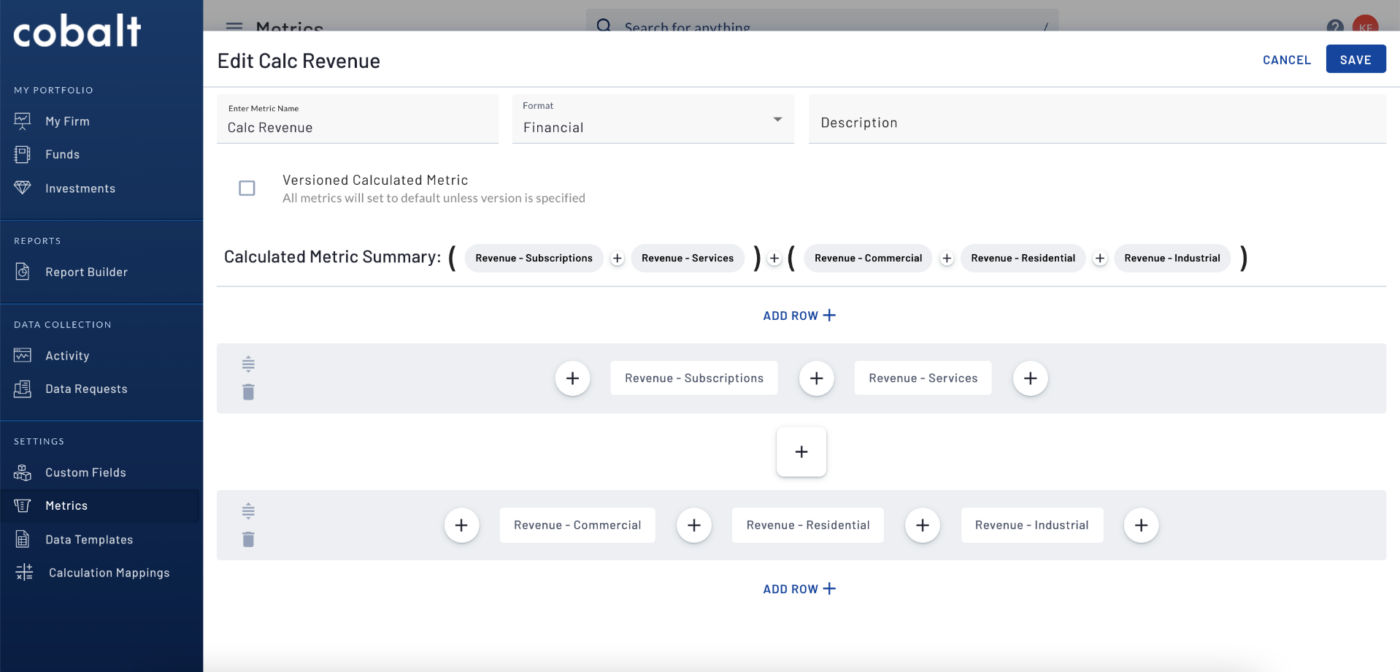
Advanced Calculation Engine
- Metrics you use: Define and calculate the metrics that define success at your firm.
- On the timeline you follow: Automatically aggregate data to summarize by quarter or year, including calendar and fiscal periods, LTM, etc.
- With the formulas you need: Define the formulas you need, so you can drill down into performance metrics the way you actually think about them (i.e. revenue by region, sector, or product; across metrics versions; or performance over a period).
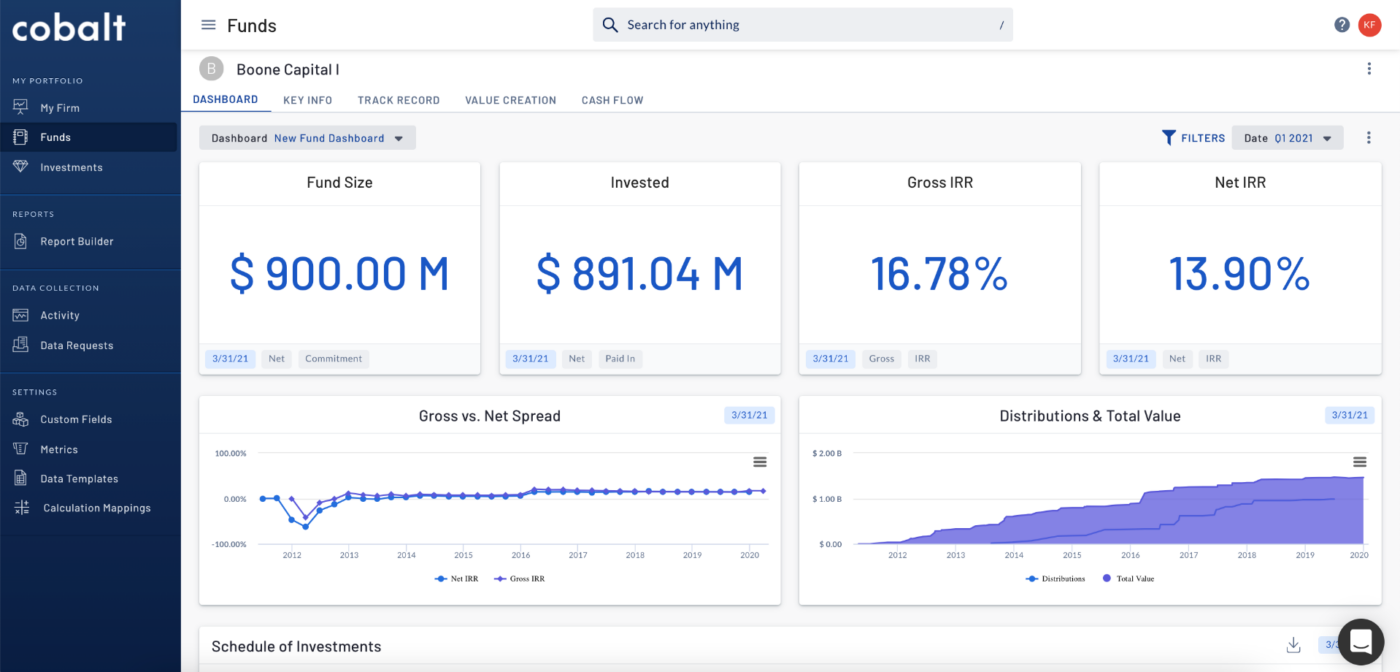
Cash Flow Analytics
- Calculate performance metrics including IRR, TVPI, DVPI, and RVPI.
- Visualize fund performance, value creation, deal scoring, dispersion analysis, cash flow attribution analysis, PME modeling, and much more.
- Generate LP- and partner-ready charts, tables, and other “data visualizations” for inclusion in critical reports (i.e. LP reports, peer and data reports).
Excel Plug-in
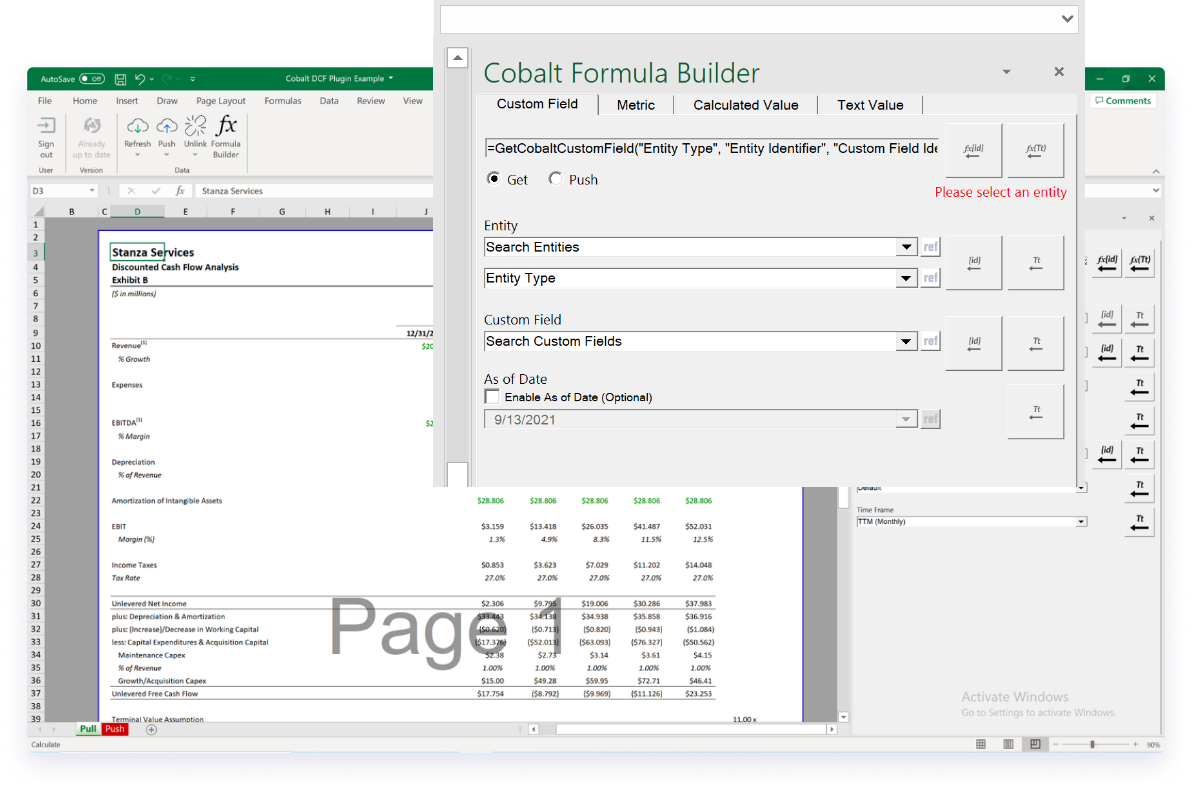
- Populate and update existing spreadsheets with data from Cobalt.
- Push data from your Excel models back to the Cobalt database when you are ready to use that data in other reports.
Cobalt’s API & Data Delivery Services
Cobalt API and webhook services seamlessly integrate your mission-critical platforms so you can unlock the strategic potential of your data off-platform. Our Data Delivery Services take that one step further by streamlining data management for storing and analysis, leading to easier collaboration, scalability, and accelerated insights.
Leverage data from your: