Chart of the Month: February 2023
Halftime Adjustments: Taking Stock of Alternative Markets Returns in Q1 & Q2, 2022
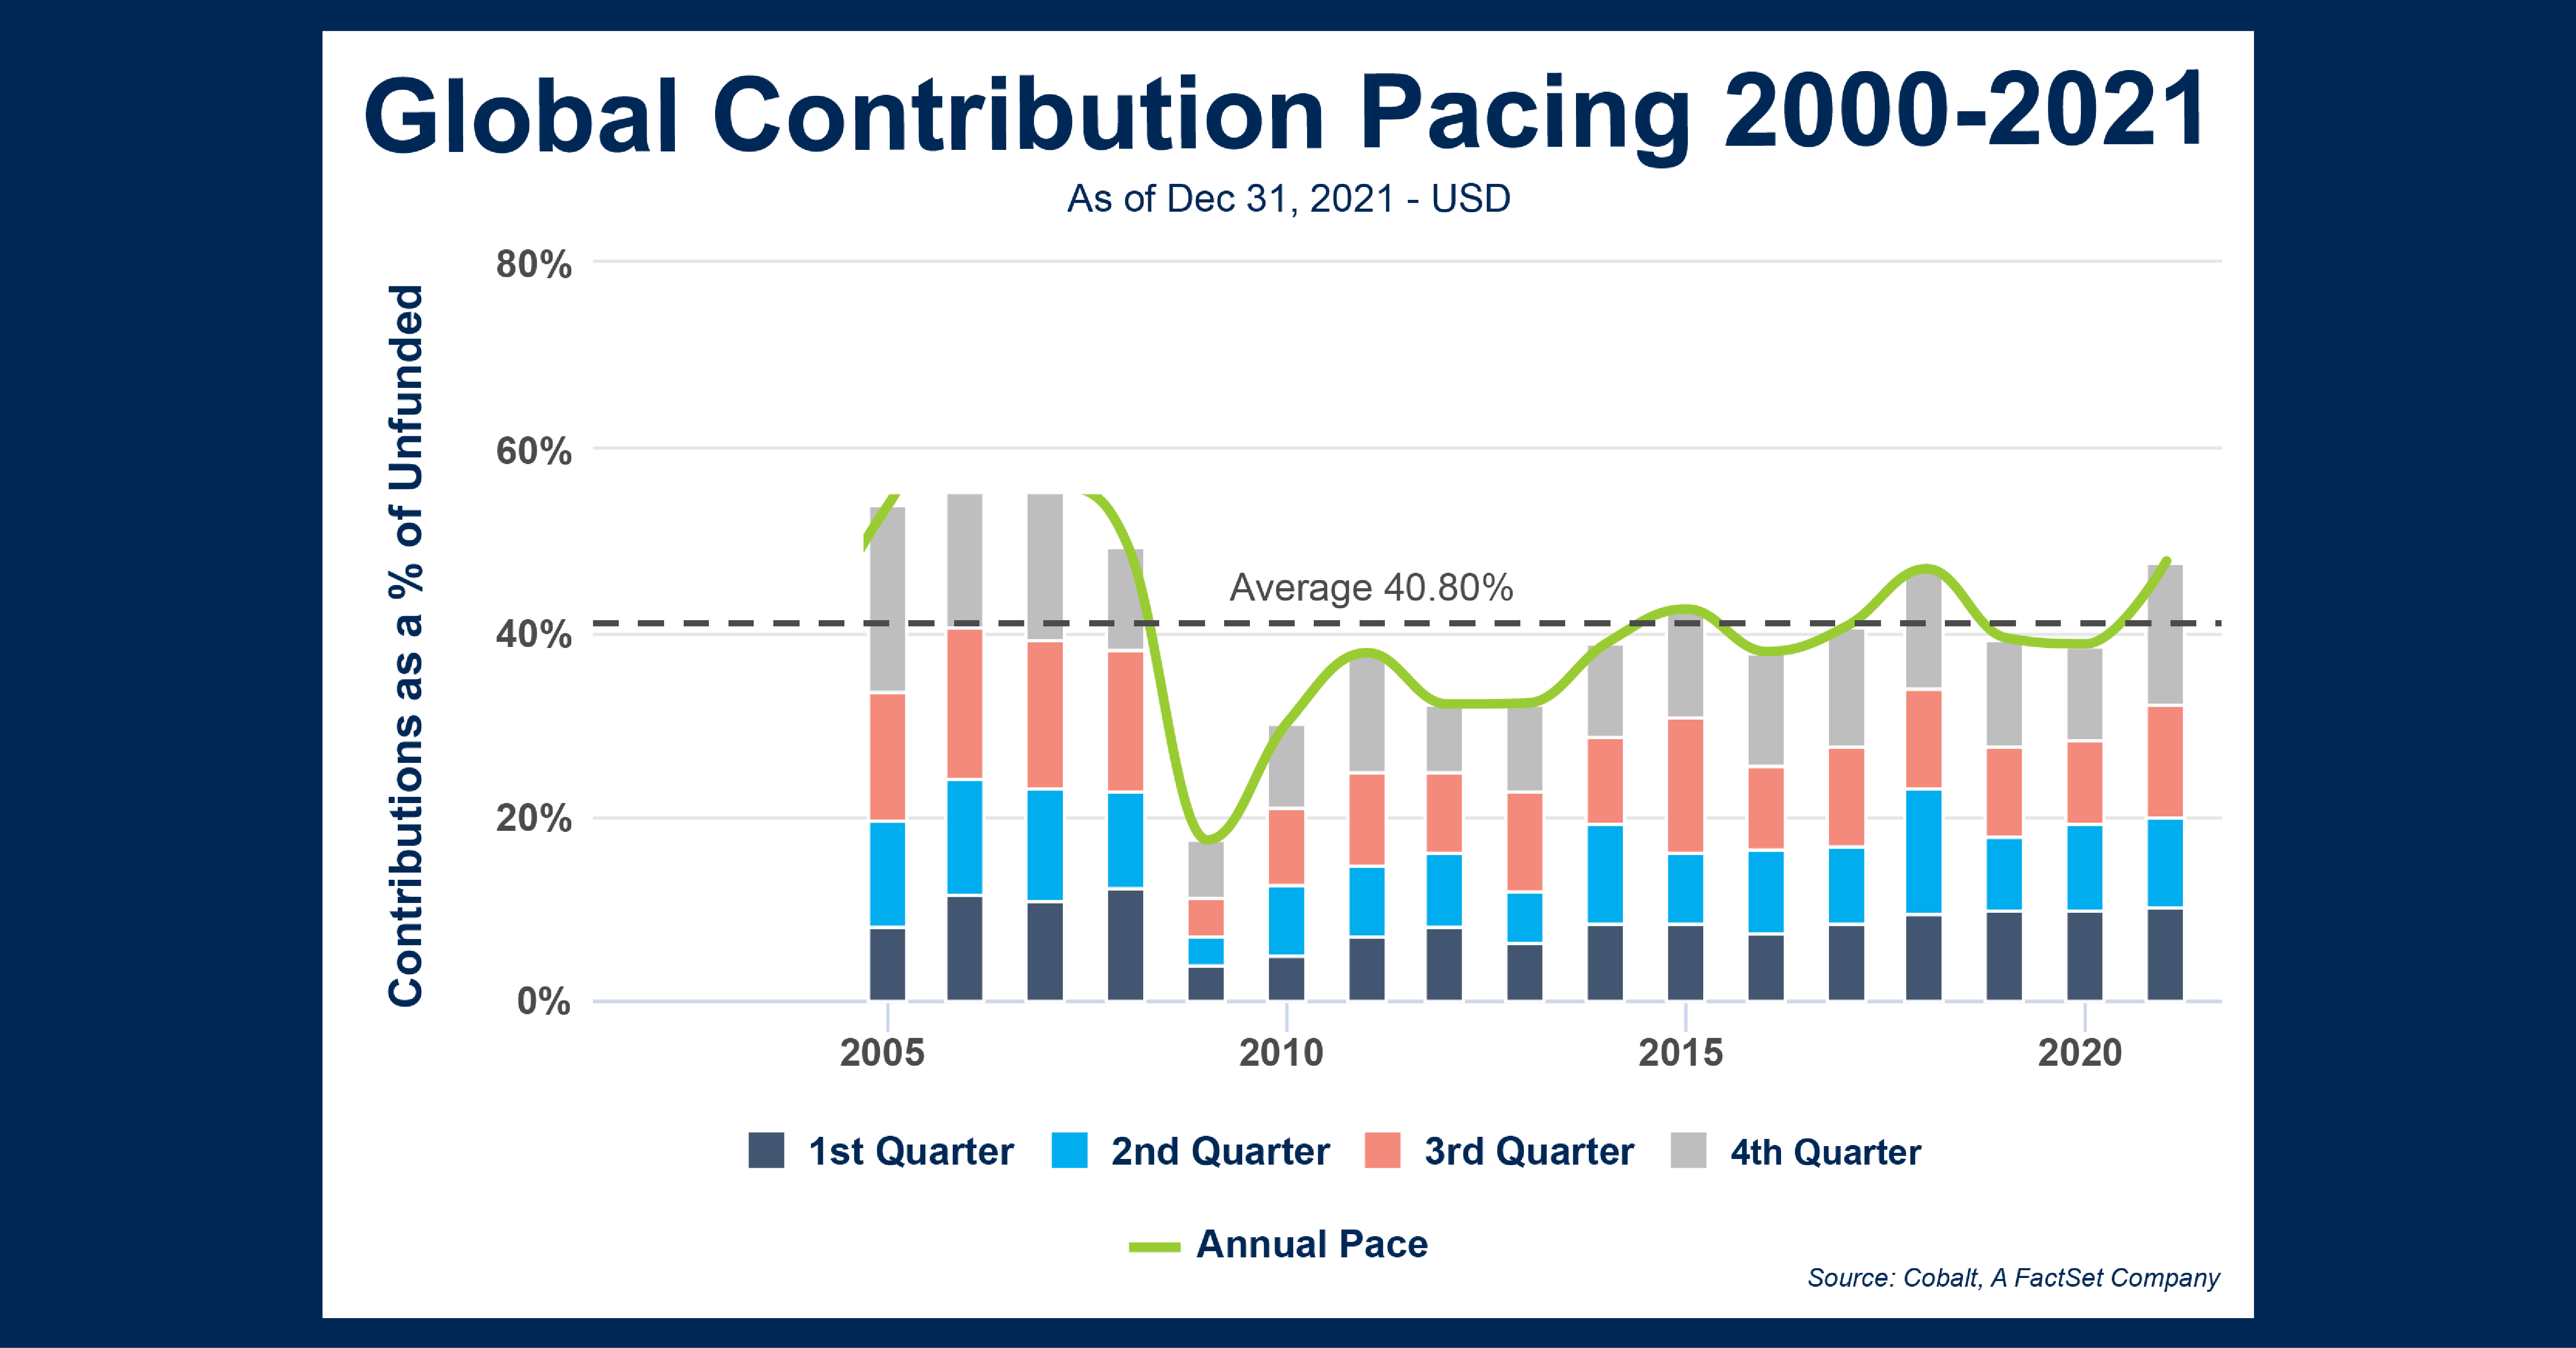
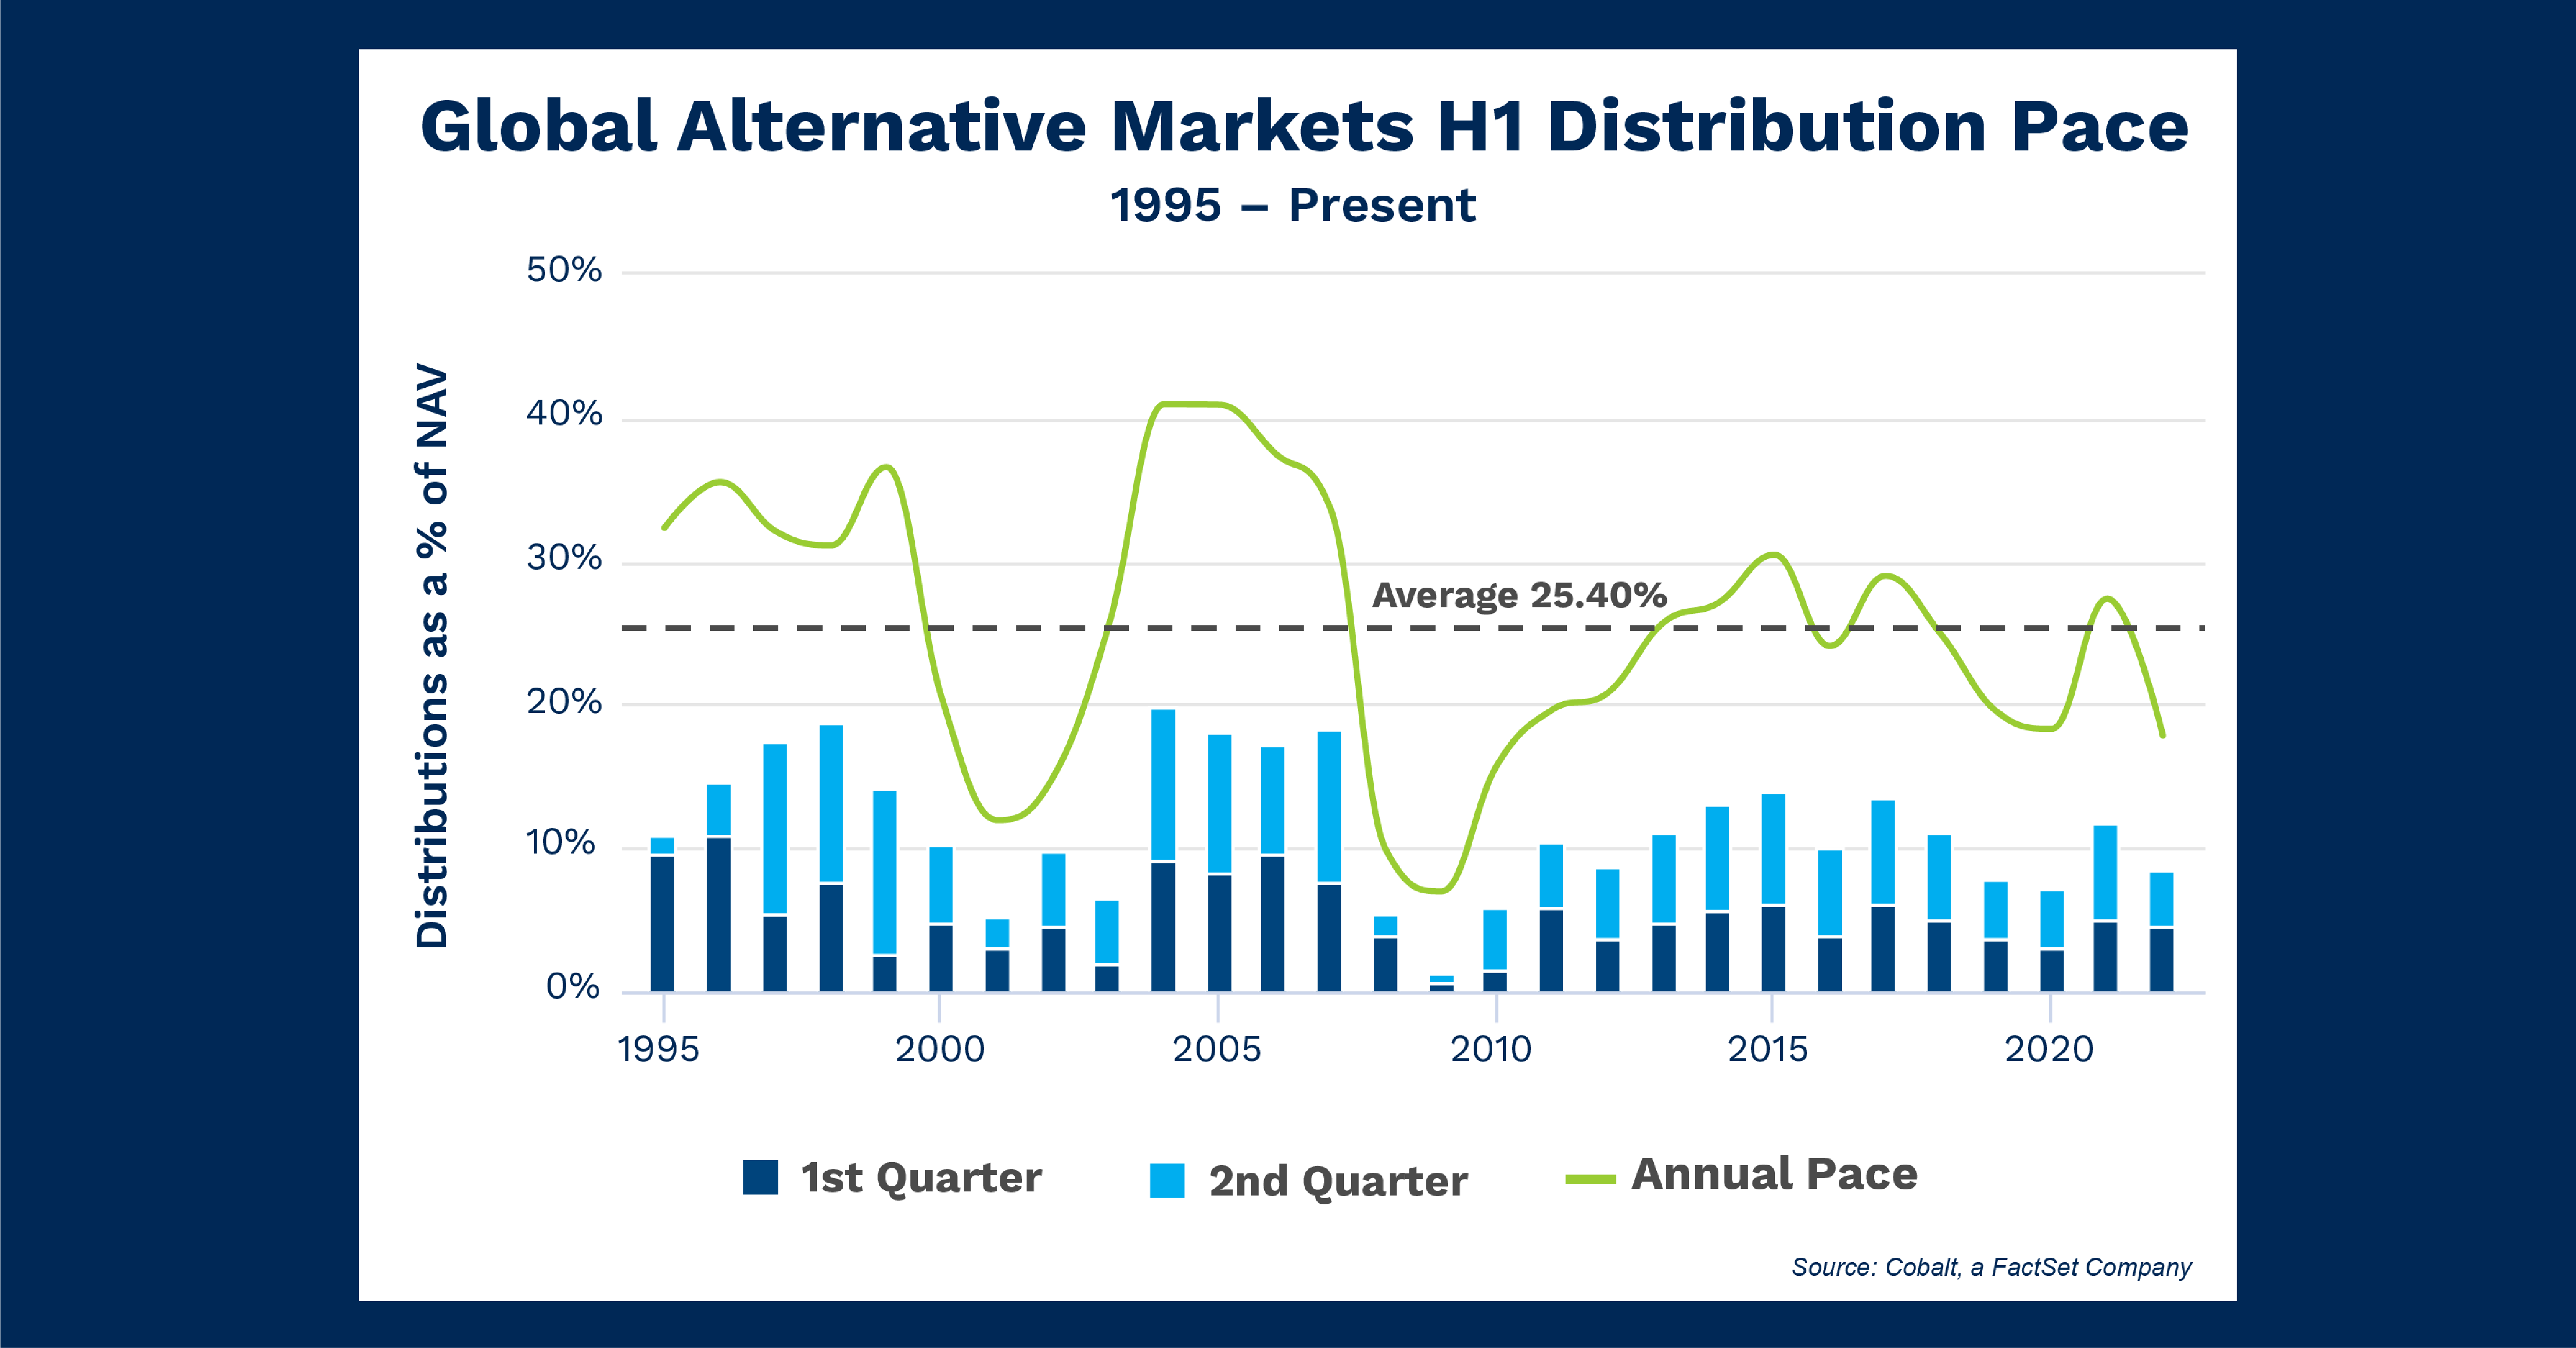
Cobalt, a FactSet Company, recently published its Q2 2022 Fund-Level Benchmark and assessed how fund returns compared to past trends in the alternative markets. We used our Distribution Pace analysis, which calculates distributions as a percent of net asset value (NAV), to indicate the proportion of a fund’s assets being realized. Our Market Analysis engine allows us to filter by quarters, providing a level comparison for the 2022 data. In the chart below, the “Annual Pace” trendline represents the actual distribution pace for all completed years. The 2022 projection is based on current numbers through the first two quarters of that year.
Key Takeaways:
- In 2022, we saw a 4.6% distribution pace in Q1 and 4.0% in Q2, which projects a 17.9% pace for the entire year. This is lower than the distribution pace in 2020 and the lowest since 2010 when recovery from the Global Financial Crisis began. This indicates distribution activity aligning with broader market conditions. The stifled 2022 projection reflects those markets worldwide were grappling with inflation and a weak stock market.
- The full year 2022 8.6% distribution pace, while lower than the first half 2022 average of 11.5%, is higher than the H1 pace in both 2019 and 2020. This points to a broader trend across the 25+ years of data in the chart, as H1 distributions in a given year account for roughly 45% of the overall pace on average, with an uptick to 55% for H2 in a given year.
Looking Ahead:
- Based on historical averages, as the rest of 2022 data is released, we expect an uptick in pacing over the second half of last year. Public markets also support this, as the S&P 500 Index saw 6% returns from June to December 2022. This could be offset by another drawdown in Q3 2022, followed by a year-end rally and a strong Q4 2022. Paired with inflation concerns, it’s not a given that the second half of 2022 will follow the expected growth pattern.
- With Q3 data collection beginning in the coming weeks, we will share another Insight article with an early indication of what lies ahead for H2 2022 distributions.
Subscribe to our blog:

Is There Geographic Bias in Macro Liquidity Trends in Private Markets?
Is There Geographic Bias in Macro Liquidity Trends in Private Markets? Building on our previous analysis of the role of…

Private Equity Performance: Large Strategies Versus Funds of Funds, Co-Investments, and Secondaries
Private Equity Performance: Large Strategies Versus Funds of Funds, Co-Investments, and Secondaries In private equity, the large strategies of buyouts,…

Examining Tariff Policy Impacts on Private Fund Contribution Rates
Examining Tariff Policy Impacts on Private Fund Contribution Rates Recently we examined the impact of Latin America presidential elections—which carry presumptions…