Law of Averages: Comparing 3 Decades of Commitments Among Buyout, Venture Capital, and Credit Funds
In private markets, we regularly analyze three main facets of our Cobalt market dataset— performance, fundraising, and cash flows—to gain insight into the fund commitments that limited partners (LPs) have made across their portfolios. Today we’re analyzing those commitments to see what we can learn about optimal portfolio construction, just as we’ve done in the past.
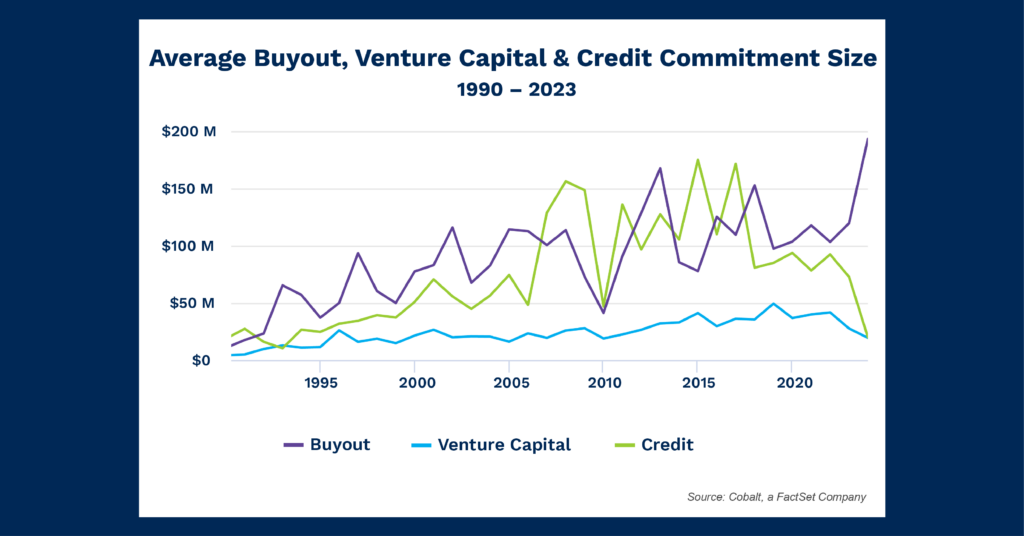
This chart highlights the average commitment sizes from 1990 through 2023 among three of the main alternative investment styles: buyout, venture capital, and credit.
Key Takeaways
That chart illustrates some well-known points in the alternatives investment space.
- Venture capital set the baseline of lowest average commitment size at $20 million over the last 30 years.
- There’s also a general trend of commitments rising over time, in line with the growth of private equity during the 2000s and 2010s.
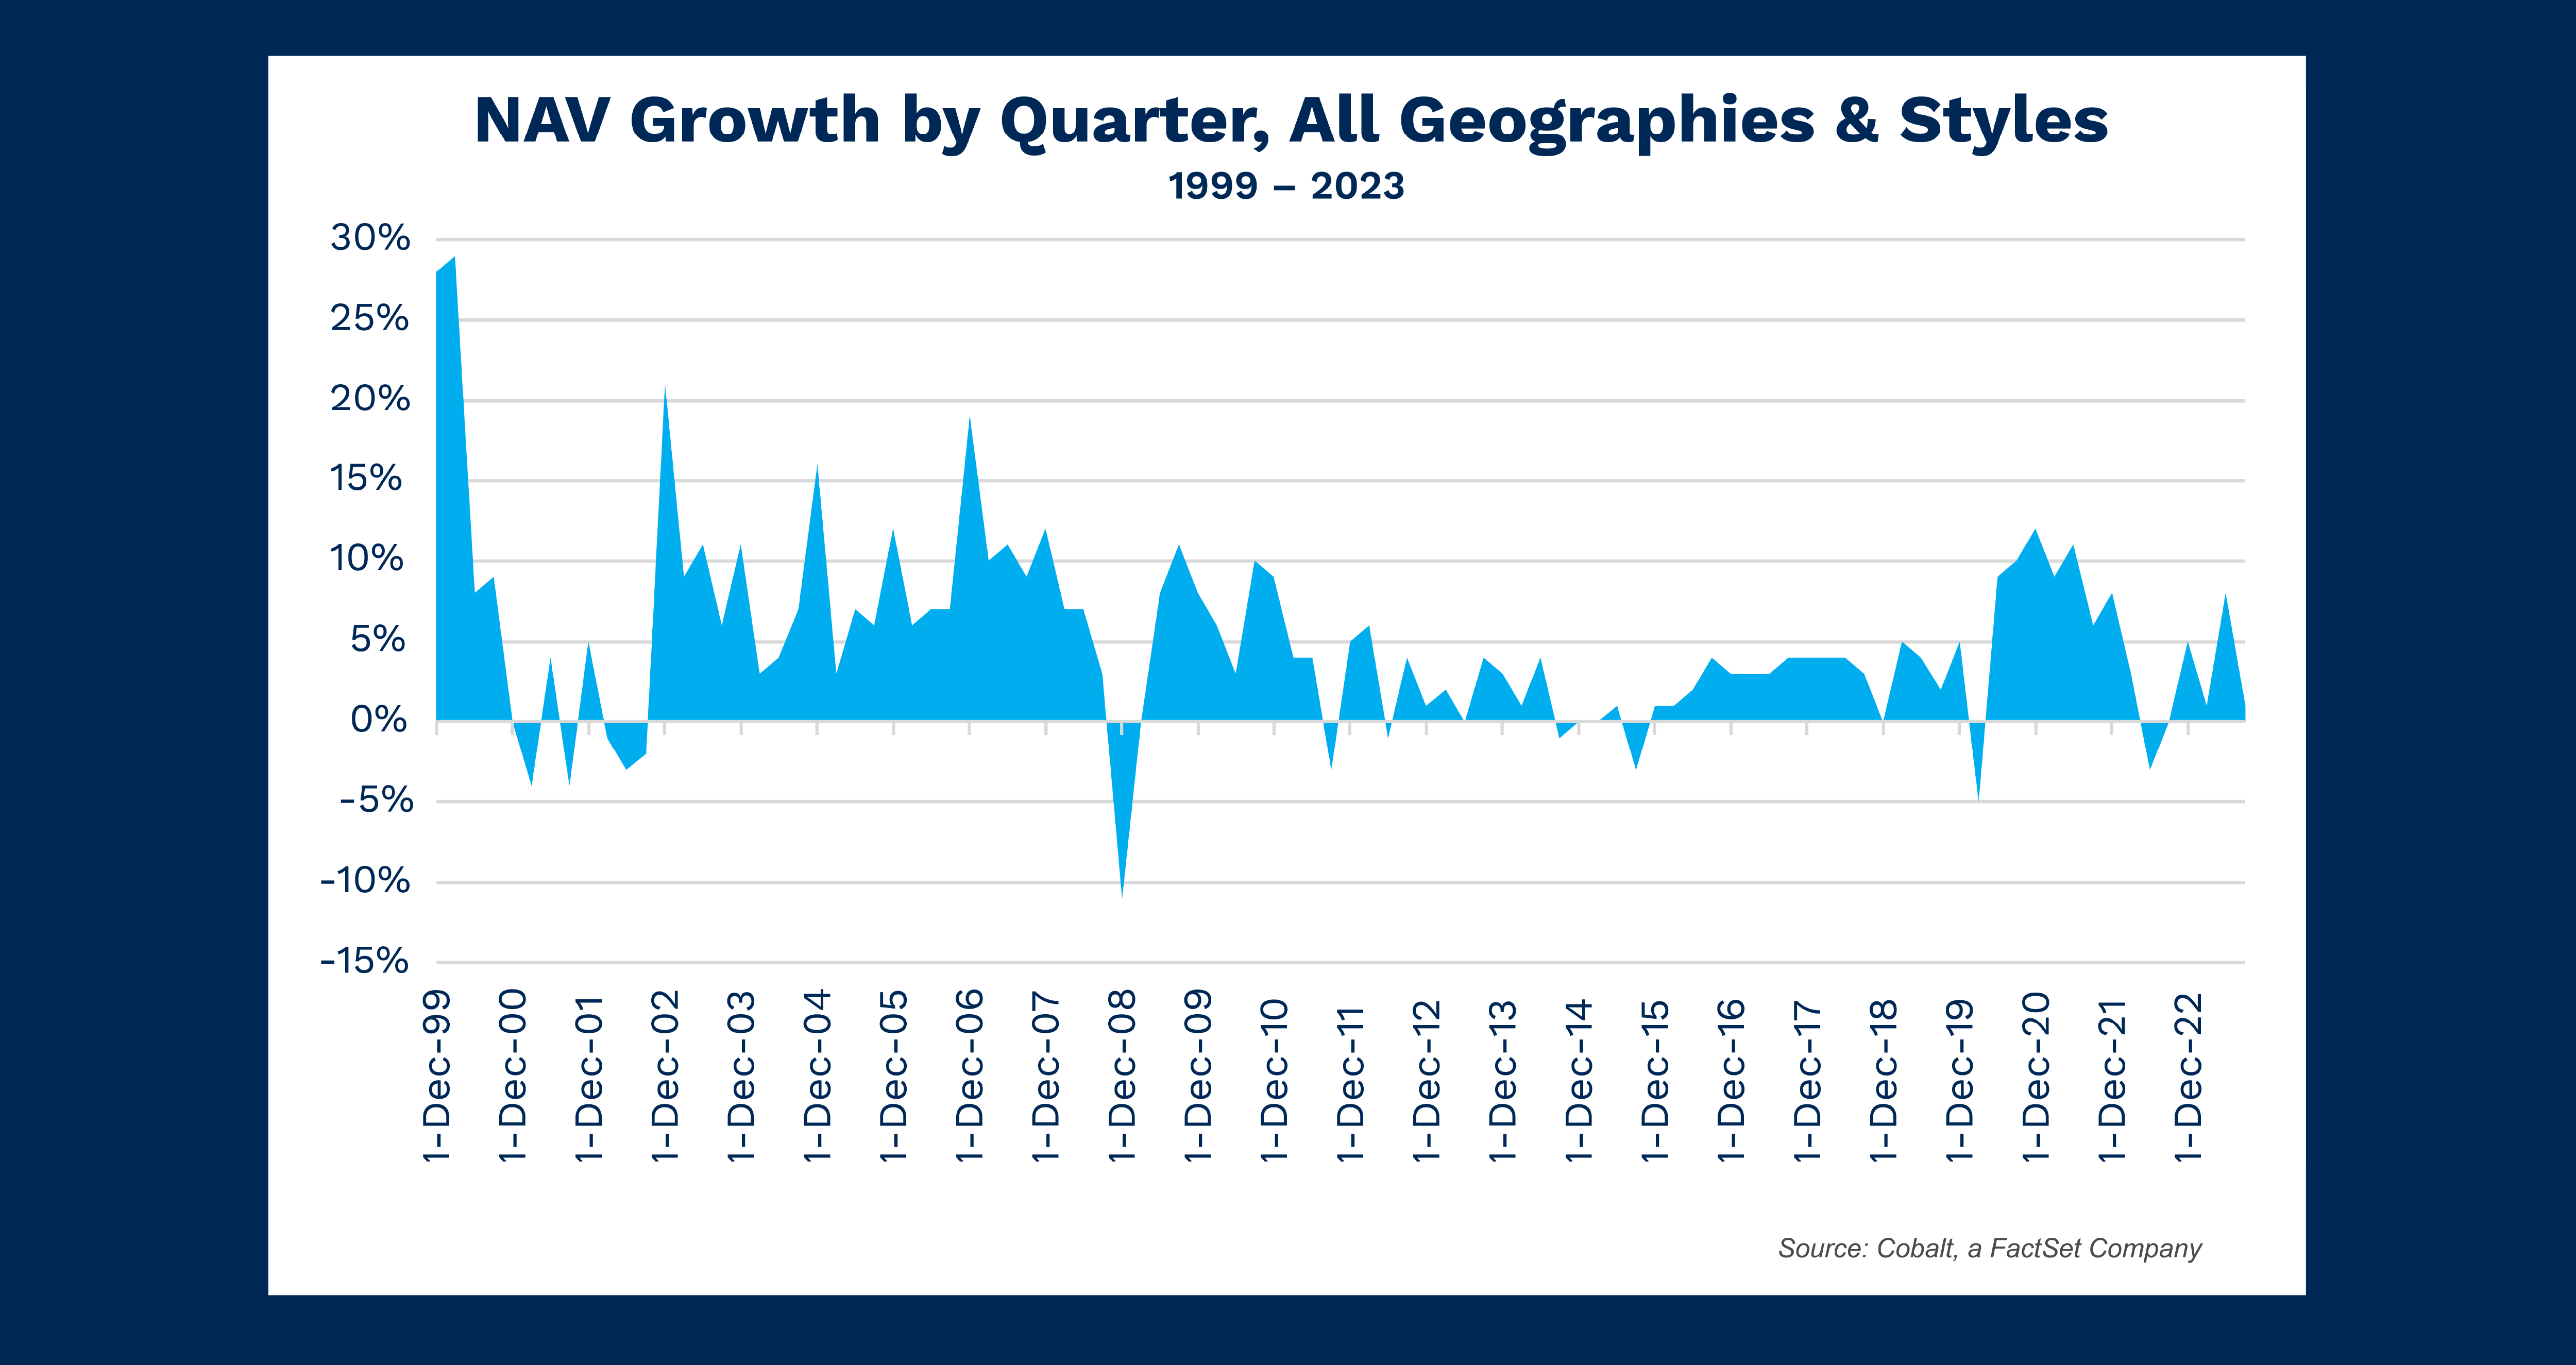
- The largest exception in the chart is from 2009 – 2011 during the financial crisis, when average commitments dropped rapidly (down nearly 50% from 2008).
- Altogether, the trends imply that average LP investment levels generally chart with the health of the market over time.
Surprisingly, the largest LP commitment sizes by investment type swapped, with credit having the larger average for nearly a decade between 2007 and 2017. That’s despite buyout firms having raised over double the amount in fund size compared to performance in the same timeframe. In other words, there was likely a smaller LP base with a sizable allocation to credit, but that smaller base made larger investments, on average.
Nearing midway through the current decade, we are seeing a clear divergence: Buyouts have grown their average investment size 64%, while credit has lowered investments by 74%.
Looking Ahead
Our 2023 data show that credit barely exceeds venture averages. If the pattern persists, it would be the first time since 1993 that they come in as the lowest of the three strategies.
While high interest rates are the largest macro factors in the private credit market, our investor data also shows a changing trend in portfolio creation that may be factoring into the dropping commitment average. From 2000 – 2009, LPs with credit investments averaged 1.7 investments per year. In the new decade (for years with complete data 2020 – 2022), the average has jumped to 2.6.
The increase may be indicating that LPs are committing a similar dollar amount from their portfolio—but spreading it across more individual funds, and therefore dropping the average check size to today’s lower levels.
It’s unlikely buyouts can maintain the last few years’ pace of growth. The previous high-growth period lasted three years (2010 – 2012), and if future years continue to look like that, we should anticipate the average buyout commitment to normalize.
One aspect that may cause this time to be different, though, is the continued expansion of buyout fund sizes compared to other strategies. Post-2015 buyouts greater than $2.5 billion have become much more commonplace, with over 30 being raised each year. That offers LPs opportunities to invest more in the funds, potentially propping up the inflated averages so far in the 2020s.
This blog post is for informational purposes only. The information contained in this blog post is not legal, tax, or investment advice. FactSet does not endorse or recommend any investments and assumes no liability for any consequence relating directly or indirectly to any action or inaction taken based on the information contained in this article.