Personalized Dashboards for IR Team
ESG-focused Deal Teams are under pressure to show transparent reporting and progress on their sustainable initiatives. In the dashboard below, we’ve included some key reporting elements that not only allow deal team professionals to incorporate ESG metric tracking into their reporting process, but still provide key financials and essential revenue updates to managers.
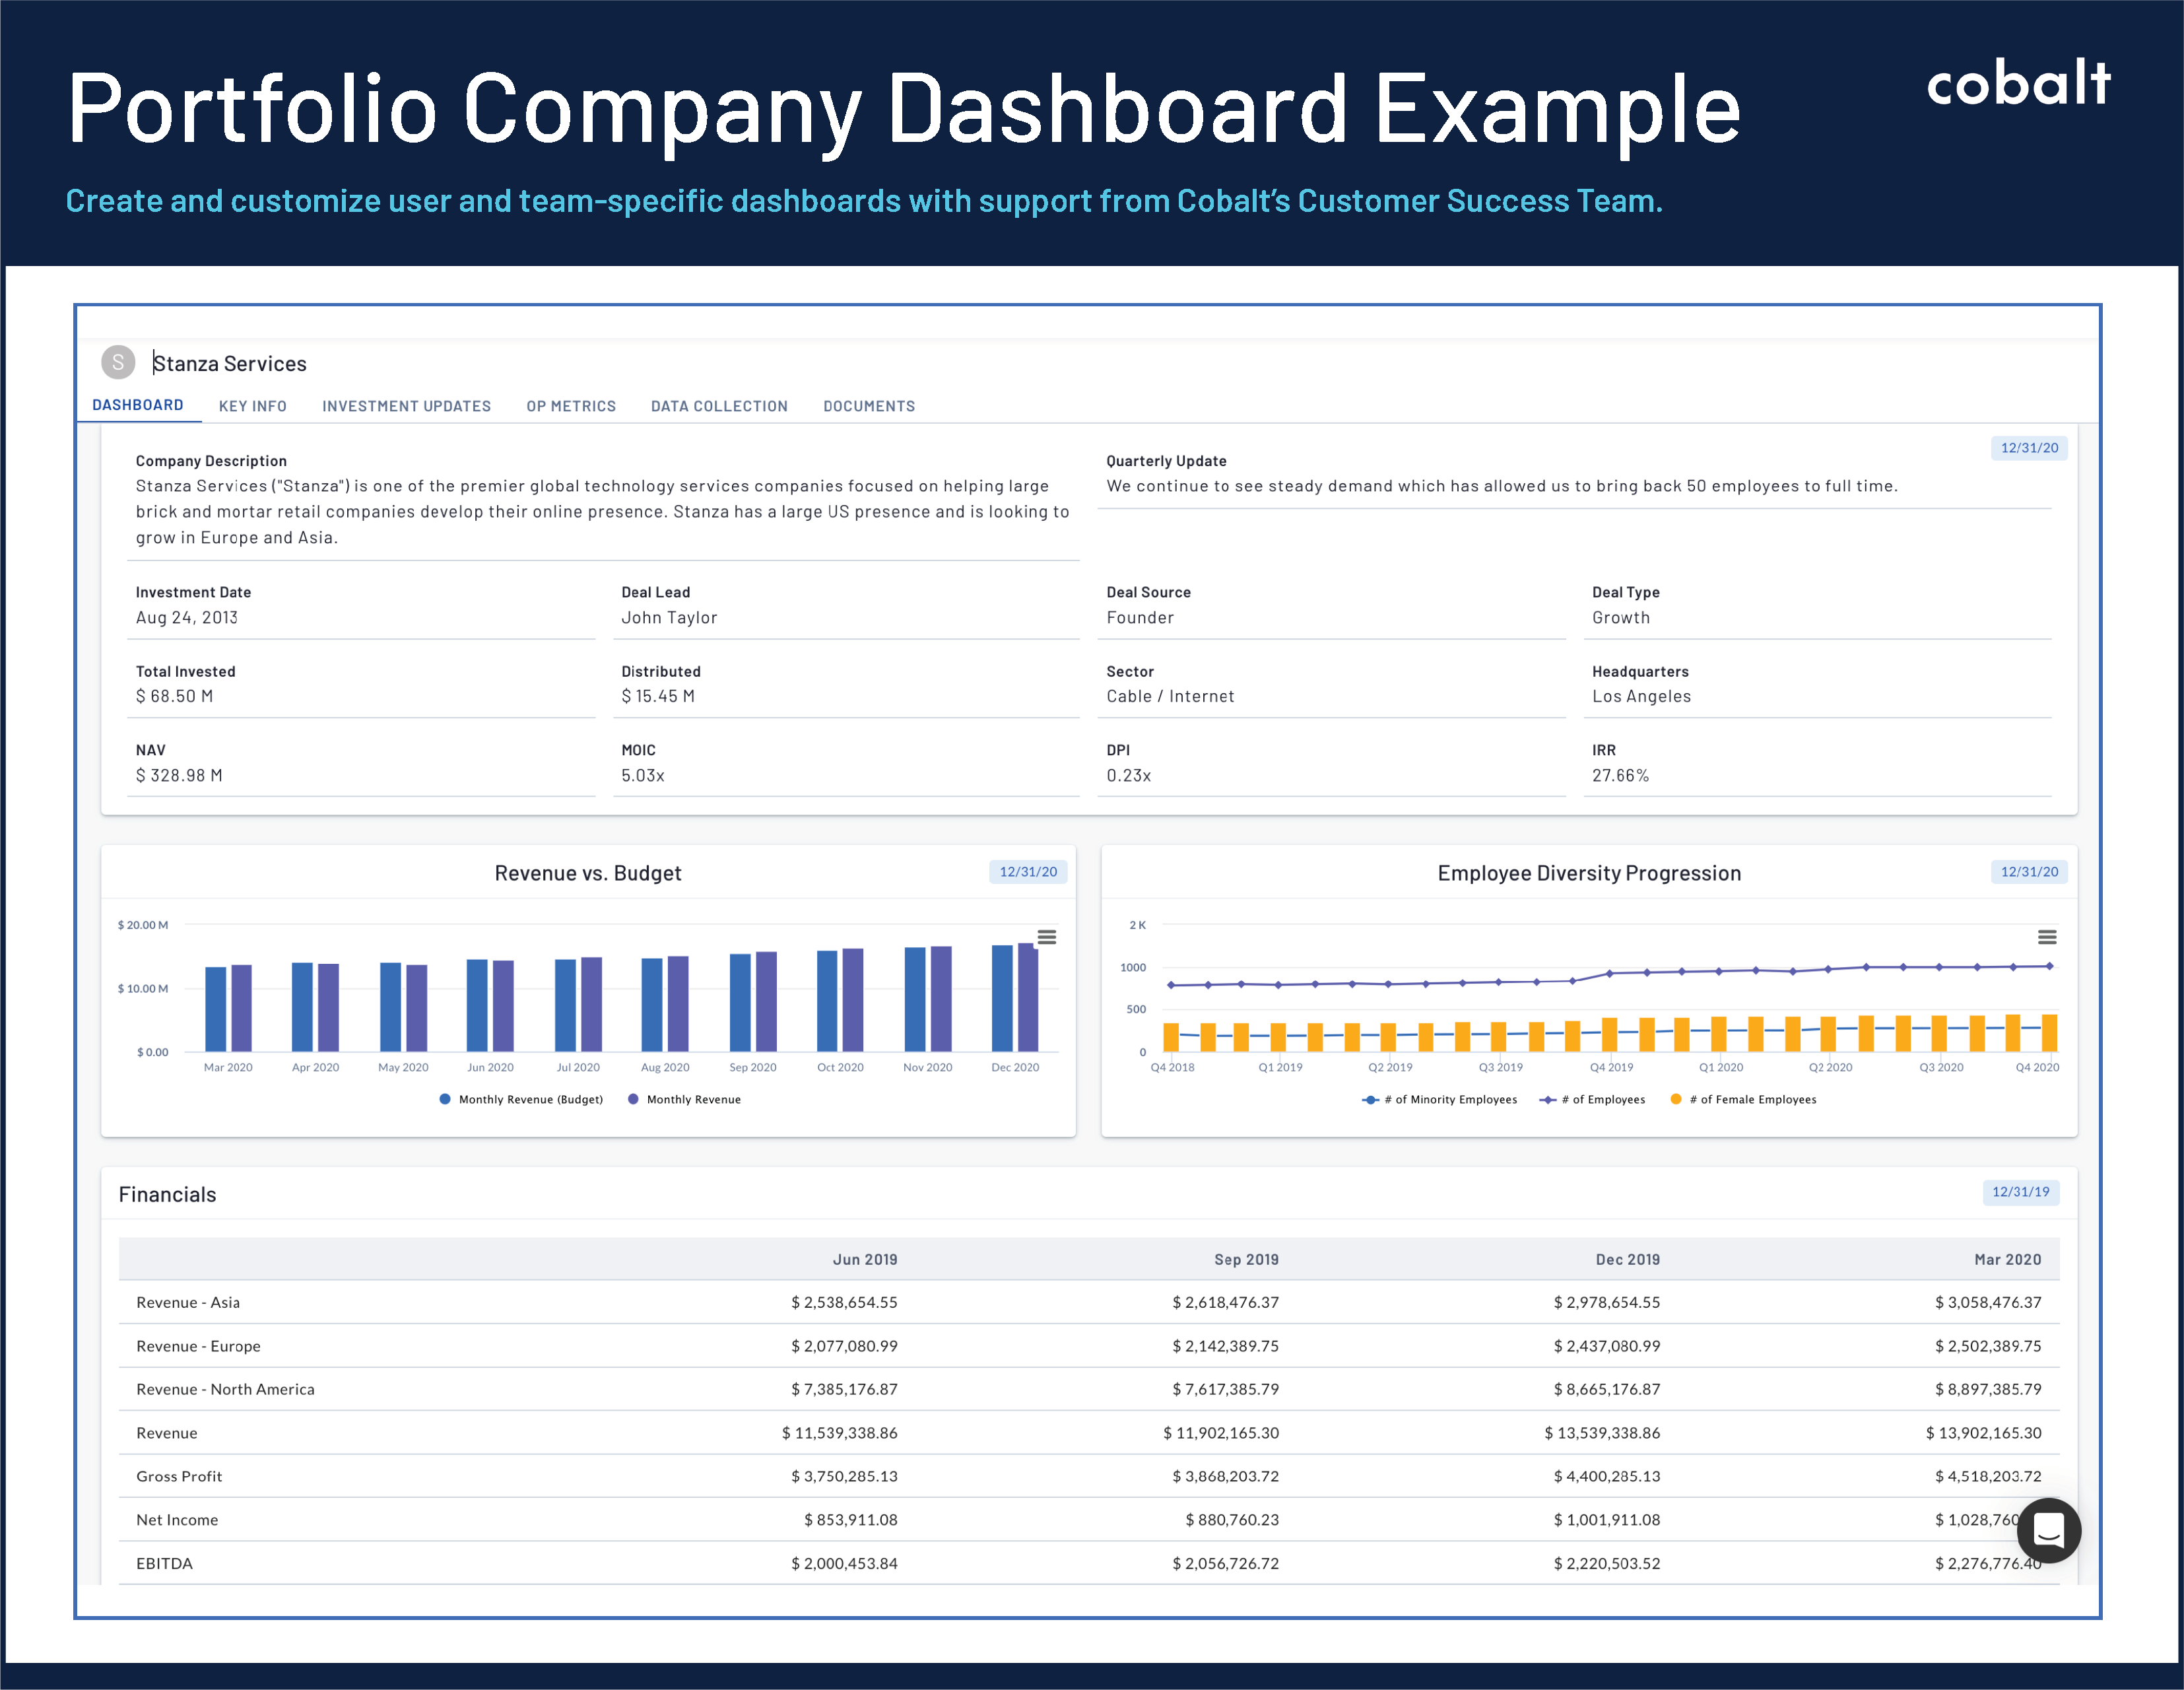
Best-practice reporting for a Deal Team with an ESG-focused Portfolio Company might include:
- Employee Diversity Progression Chart gives users the ability to track the number of minority employees and the number of female employees compared to the number of overall employees. Many investors now expect GPs to keep up with ESG reporting and be able to display metrics such as diversity headcount.
- Detailed information on the portfolio company gives a high-level overview of both performance based metrics (e.g. NAV, MOIC, DPI, and IRR) as well as qualitative fields and updates (e.g. Company Description and/or Investment Summary). These components can be displayed in multiple formats and layouts.
- Revenue vs. Budget Table allows you to compare and contrast your budgeted metrics vs. your actuals using our comprehensive selection of graphs and charts.
- Key Financials and our charts library allows you to quickly create a financial table for any company tracking financial metrics. With the flexibility to show multiple versions (e.g. Actual & Budget), periods and layers in our conditional formatting, visualizing your key financials is made easy.
Cobalt has supported many firms with best-practices as they’ve started incorporating ESG metric tracking into their investment and reporting process. Our clients track and report on more ESG factors such as:
- Environmental: CO2 emissions, water usage, energy usage
- Social: Gender pay ratio, employee diversity, injury rate
- Governance: Board diversity, ethics and anti Corruption, data privacy
Cobalt’s Portfolio Monitoring platform gives you the ability to personalize team and user-specific dashboards that are in-sync with the way your firm operates and reports performance. Users can create and customize dashboards on the fly and then easily export to professional, pixel-perfect PDFs that are always partner-ready. Request a demo of Cobalt’s dashboard capabilities today.
Subscribe to our blog:

Is There Geographic Bias in Macro Liquidity Trends in Private Markets?
Is There Geographic Bias in Macro Liquidity Trends in Private Markets? Building on our previous analysis of the role of…

Private Equity Performance: Large Strategies Versus Funds of Funds, Co-Investments, and Secondaries
Private Equity Performance: Large Strategies Versus Funds of Funds, Co-Investments, and Secondaries In private equity, the large strategies of buyouts,…

Examining Tariff Policy Impacts on Private Fund Contribution Rates
Examining Tariff Policy Impacts on Private Fund Contribution Rates Recently we examined the impact of Latin America presidential elections—which carry presumptions…