Chart of the Month: February 2022
Outsized: Examining Three Index Returns Since 2009 with a Fund Size Factor
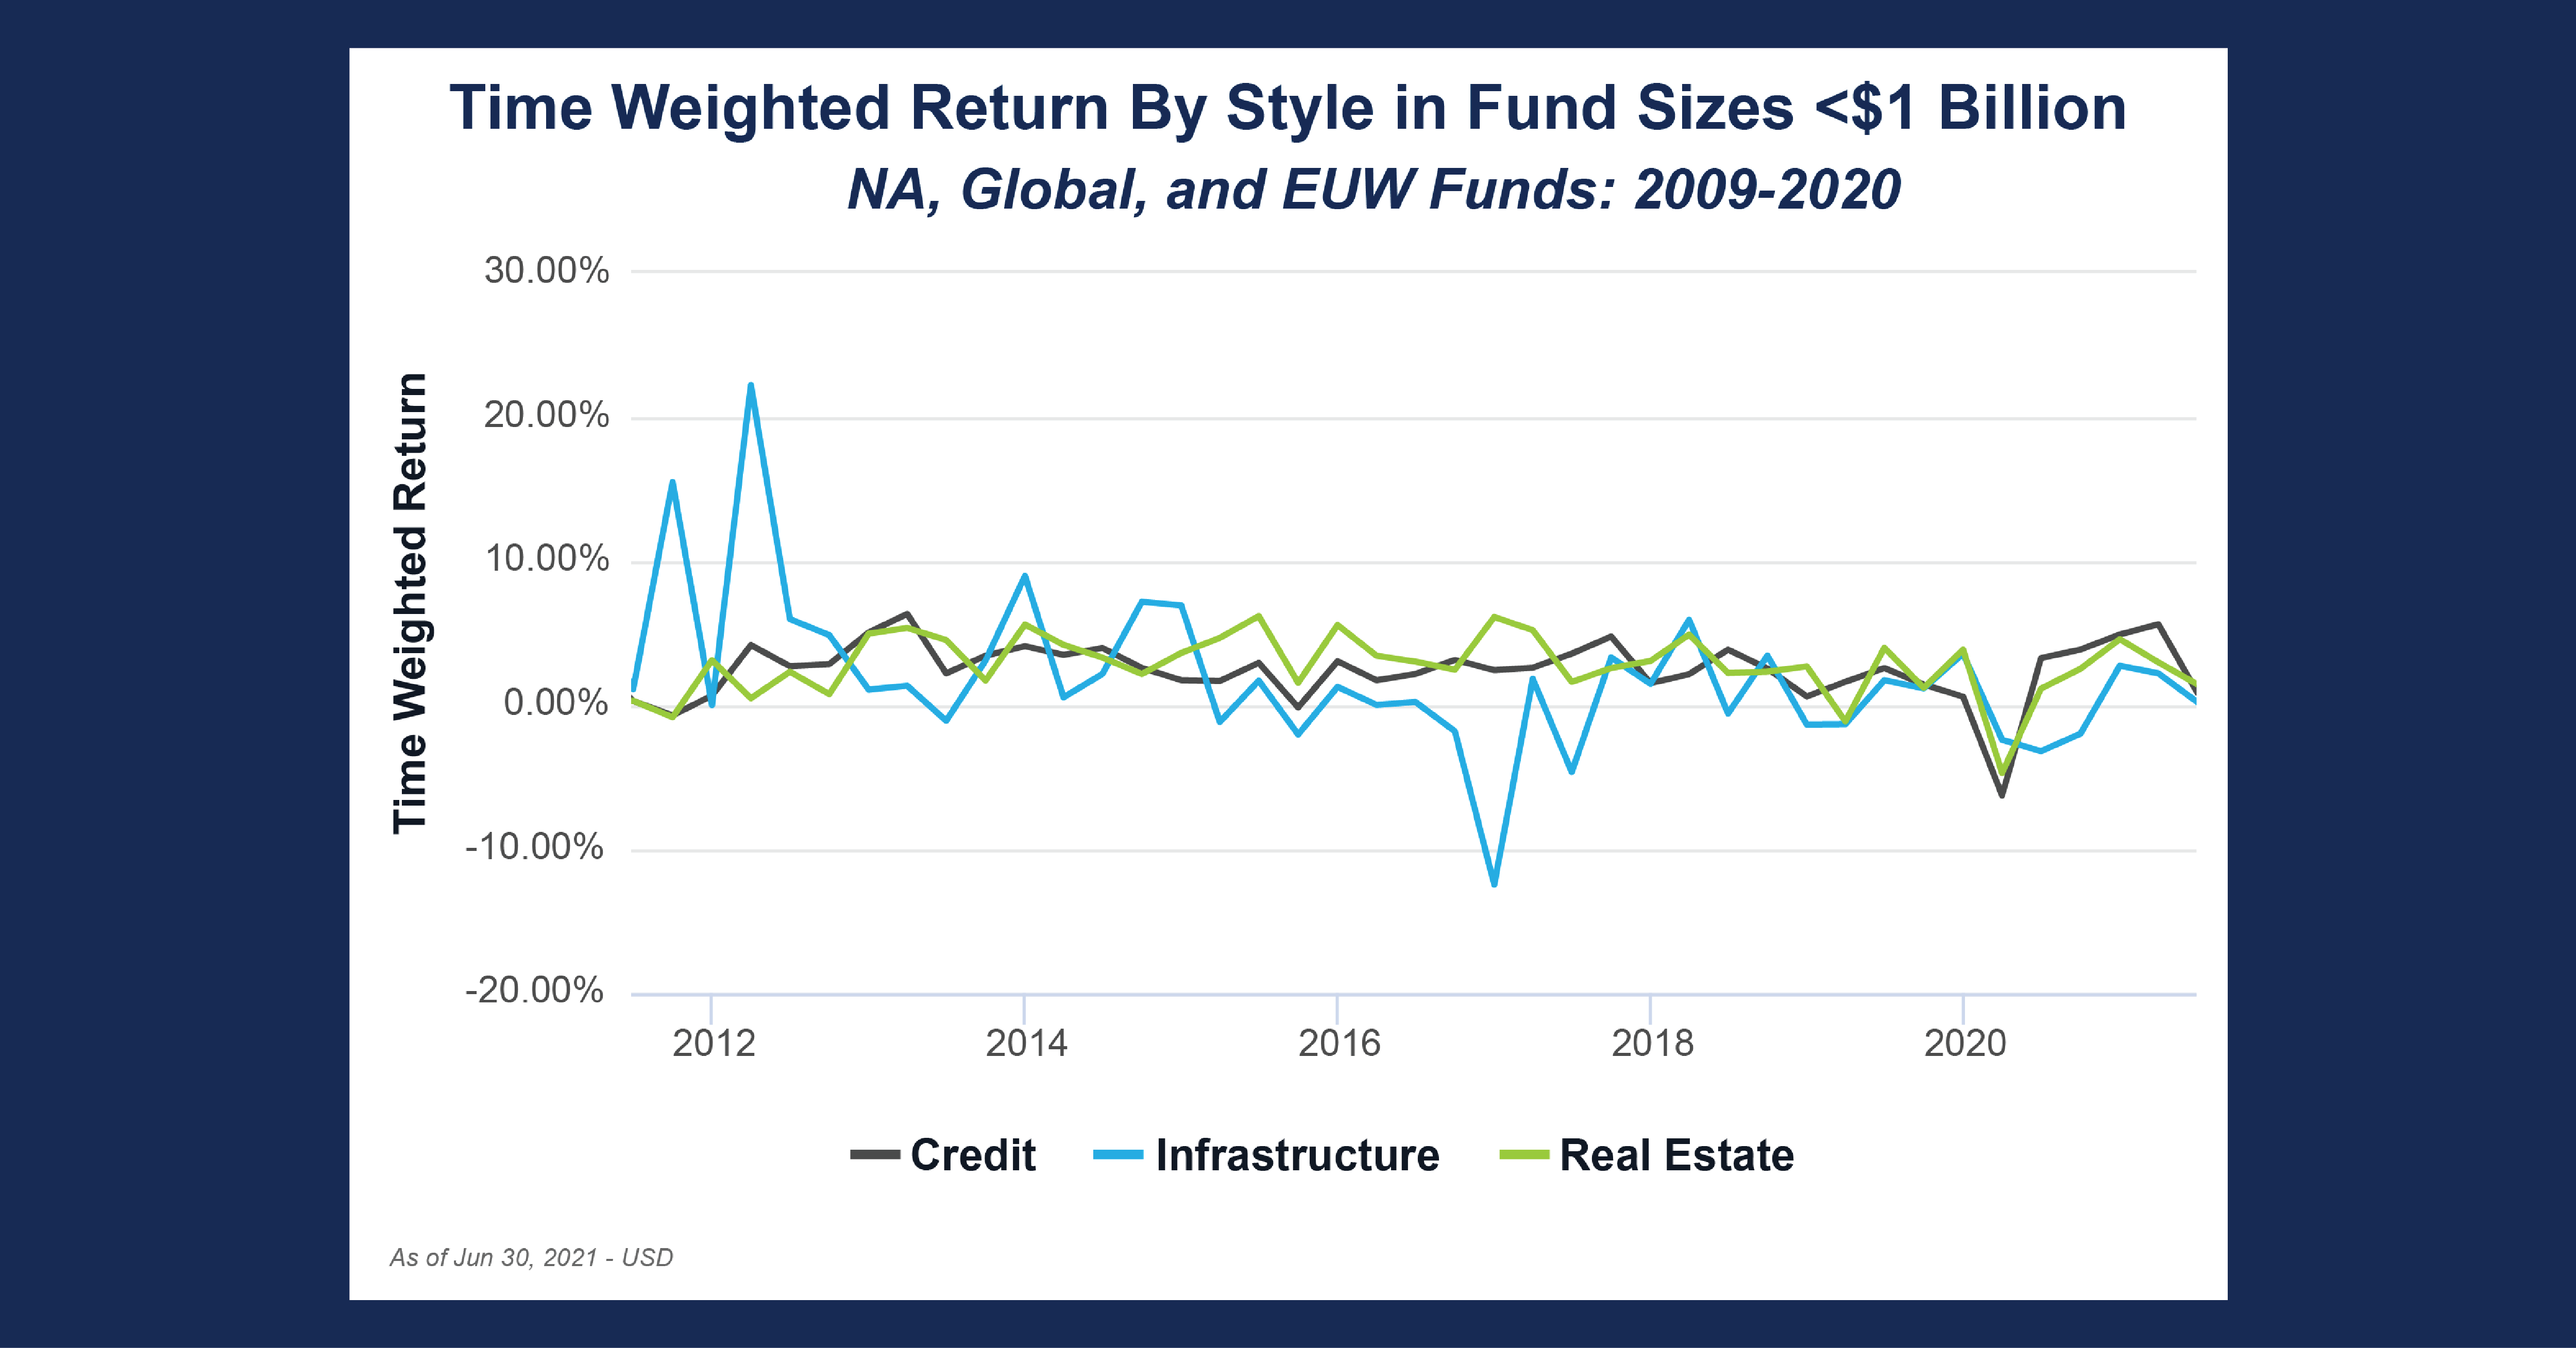
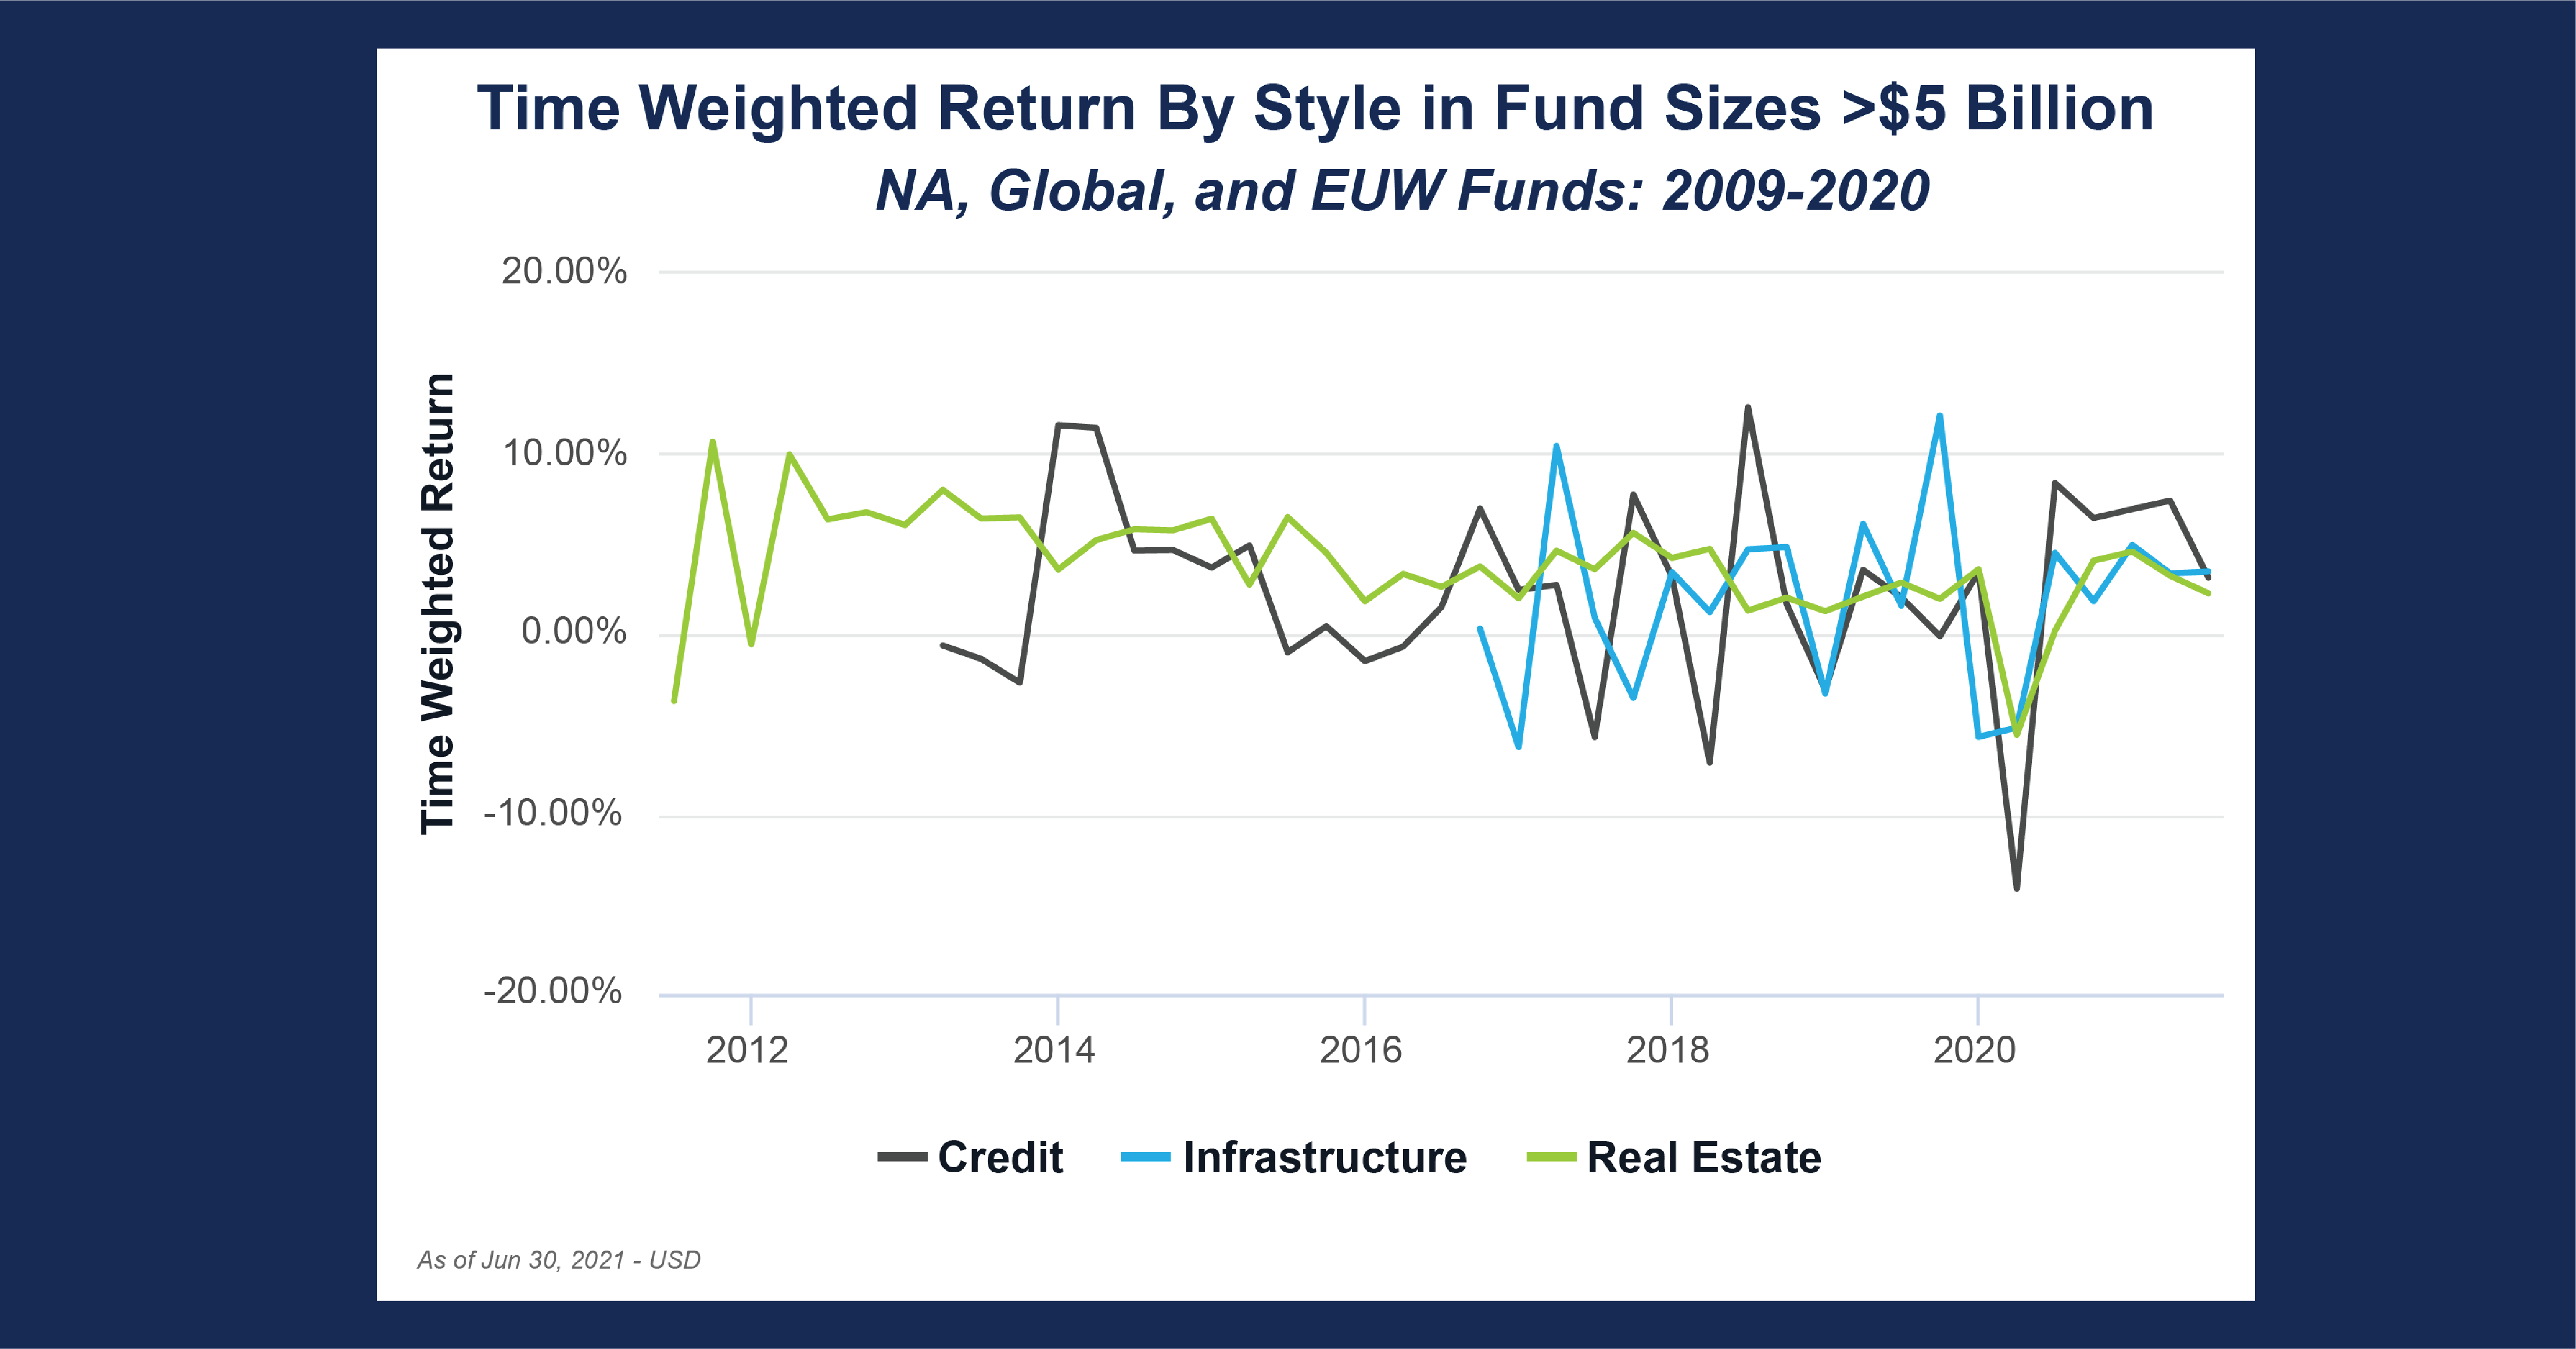
This month’s chart takes a slightly different approach and evaluates the factor of fund size and the effects it has had on recent performance returns in large markets. To visualize the impact, we used Cobalt Market Data to pull two charts over the last decade: the first examining smaller funds with size under $1 billion, and the second looking at larger funds with size over $5 billion. While the data on these large funds is largely concentrated in more recent years and may suffer from a smaller sample size, the chart still captures valuable characteristics of the effect that fund size has on performance.
Key Takeaways:
- Firstly, these returns are clearly very similar in the first five years. Across the board, there was positive performance on average regardless of fund size. Given that this was the early years of the post-GFC bull market, a strong, albeit slightly volatile, performance return makes sense to see.
- As we look at the later years, we start to see some patterns emerge. Real estate exhibits the lowest volatility in both graphs, and quite similar overall levels of performance. Regardless of size, the charts follow very similar timings of peaks and troughs, as well as in depth of deviation in drawdowns. This indicates that real estate’s consistency in performance is size agnostic. Since real estate is so consistent, its performance should stay constant as fund size is scaled.
- By contrast, infrastructure and credit show significant deviations between the small and large samples in the later 2010’s. Overall, we see a trend of lower volatility in smaller funds, which may be somewhat explained by sample size. However, there are exceptions such as the sustained drawdown of small fund infrastructure in 2017. This is not present in the large fund plot, which exhibits volatility with an average a little above 0%. Meanwhile, large fund credit exhibits consistently higher volatility, even through the 2020 drawdown and recovery. Examining these cases, we see that in some styles a size factor can emerge. In more speculative styles such as credit, size can yield economies of scale in performance, but with some leverage resembling risks. On the other hand, different fund sizes may be operating in different markets as seen in infrastructure’s disjointed performance.
Looking Ahead:
- As the prevalence of large funds rises, we will see the greater robustness of the data on these firms as volatility will likely drop as sample size increases. Additionally, with the dramatic upswing in M&A over the past year, it is quite likely that we will see significant changes in volume of larger firms.
- While real estate will likely continue to be size agnostic, we have seen eight out of the ten largest infrastructure funds raised over the last five years, demonstrating an impressive push for larger infrastructure investment. That may create a disjointed market from its smaller counterpart that could become further separated as the large fund space increases.
- For credit, while greater fund size appears to allow greater scaling returns, those same returns may offer some pause to investors seeking safety. Since dampening volatility has not appeared over time, credit funds’ reversions may continue to be most painful at the larger scale.
Subscribe to our blog:

Is There Geographic Bias in Macro Liquidity Trends in Private Markets?
Is There Geographic Bias in Macro Liquidity Trends in Private Markets? Building on our previous analysis of the role of…

Private Equity Performance: Large Strategies Versus Funds of Funds, Co-Investments, and Secondaries
Private Equity Performance: Large Strategies Versus Funds of Funds, Co-Investments, and Secondaries In private equity, the large strategies of buyouts,…

Examining Tariff Policy Impacts on Private Fund Contribution Rates
Examining Tariff Policy Impacts on Private Fund Contribution Rates Recently we examined the impact of Latin America presidential elections—which carry presumptions…