Personalized Dashboards: The Finance Team
Private Equity and Venture Capital Finance Teams need an investment-focused dashboard to report on all active investment performance and see updates in a recurring, automated way. In the dashboard below, we’ve included some key reporting elements that our clients from leading private market firms use on a daily, weekly, and quarterly basis to update their partners and respond to investor requests.
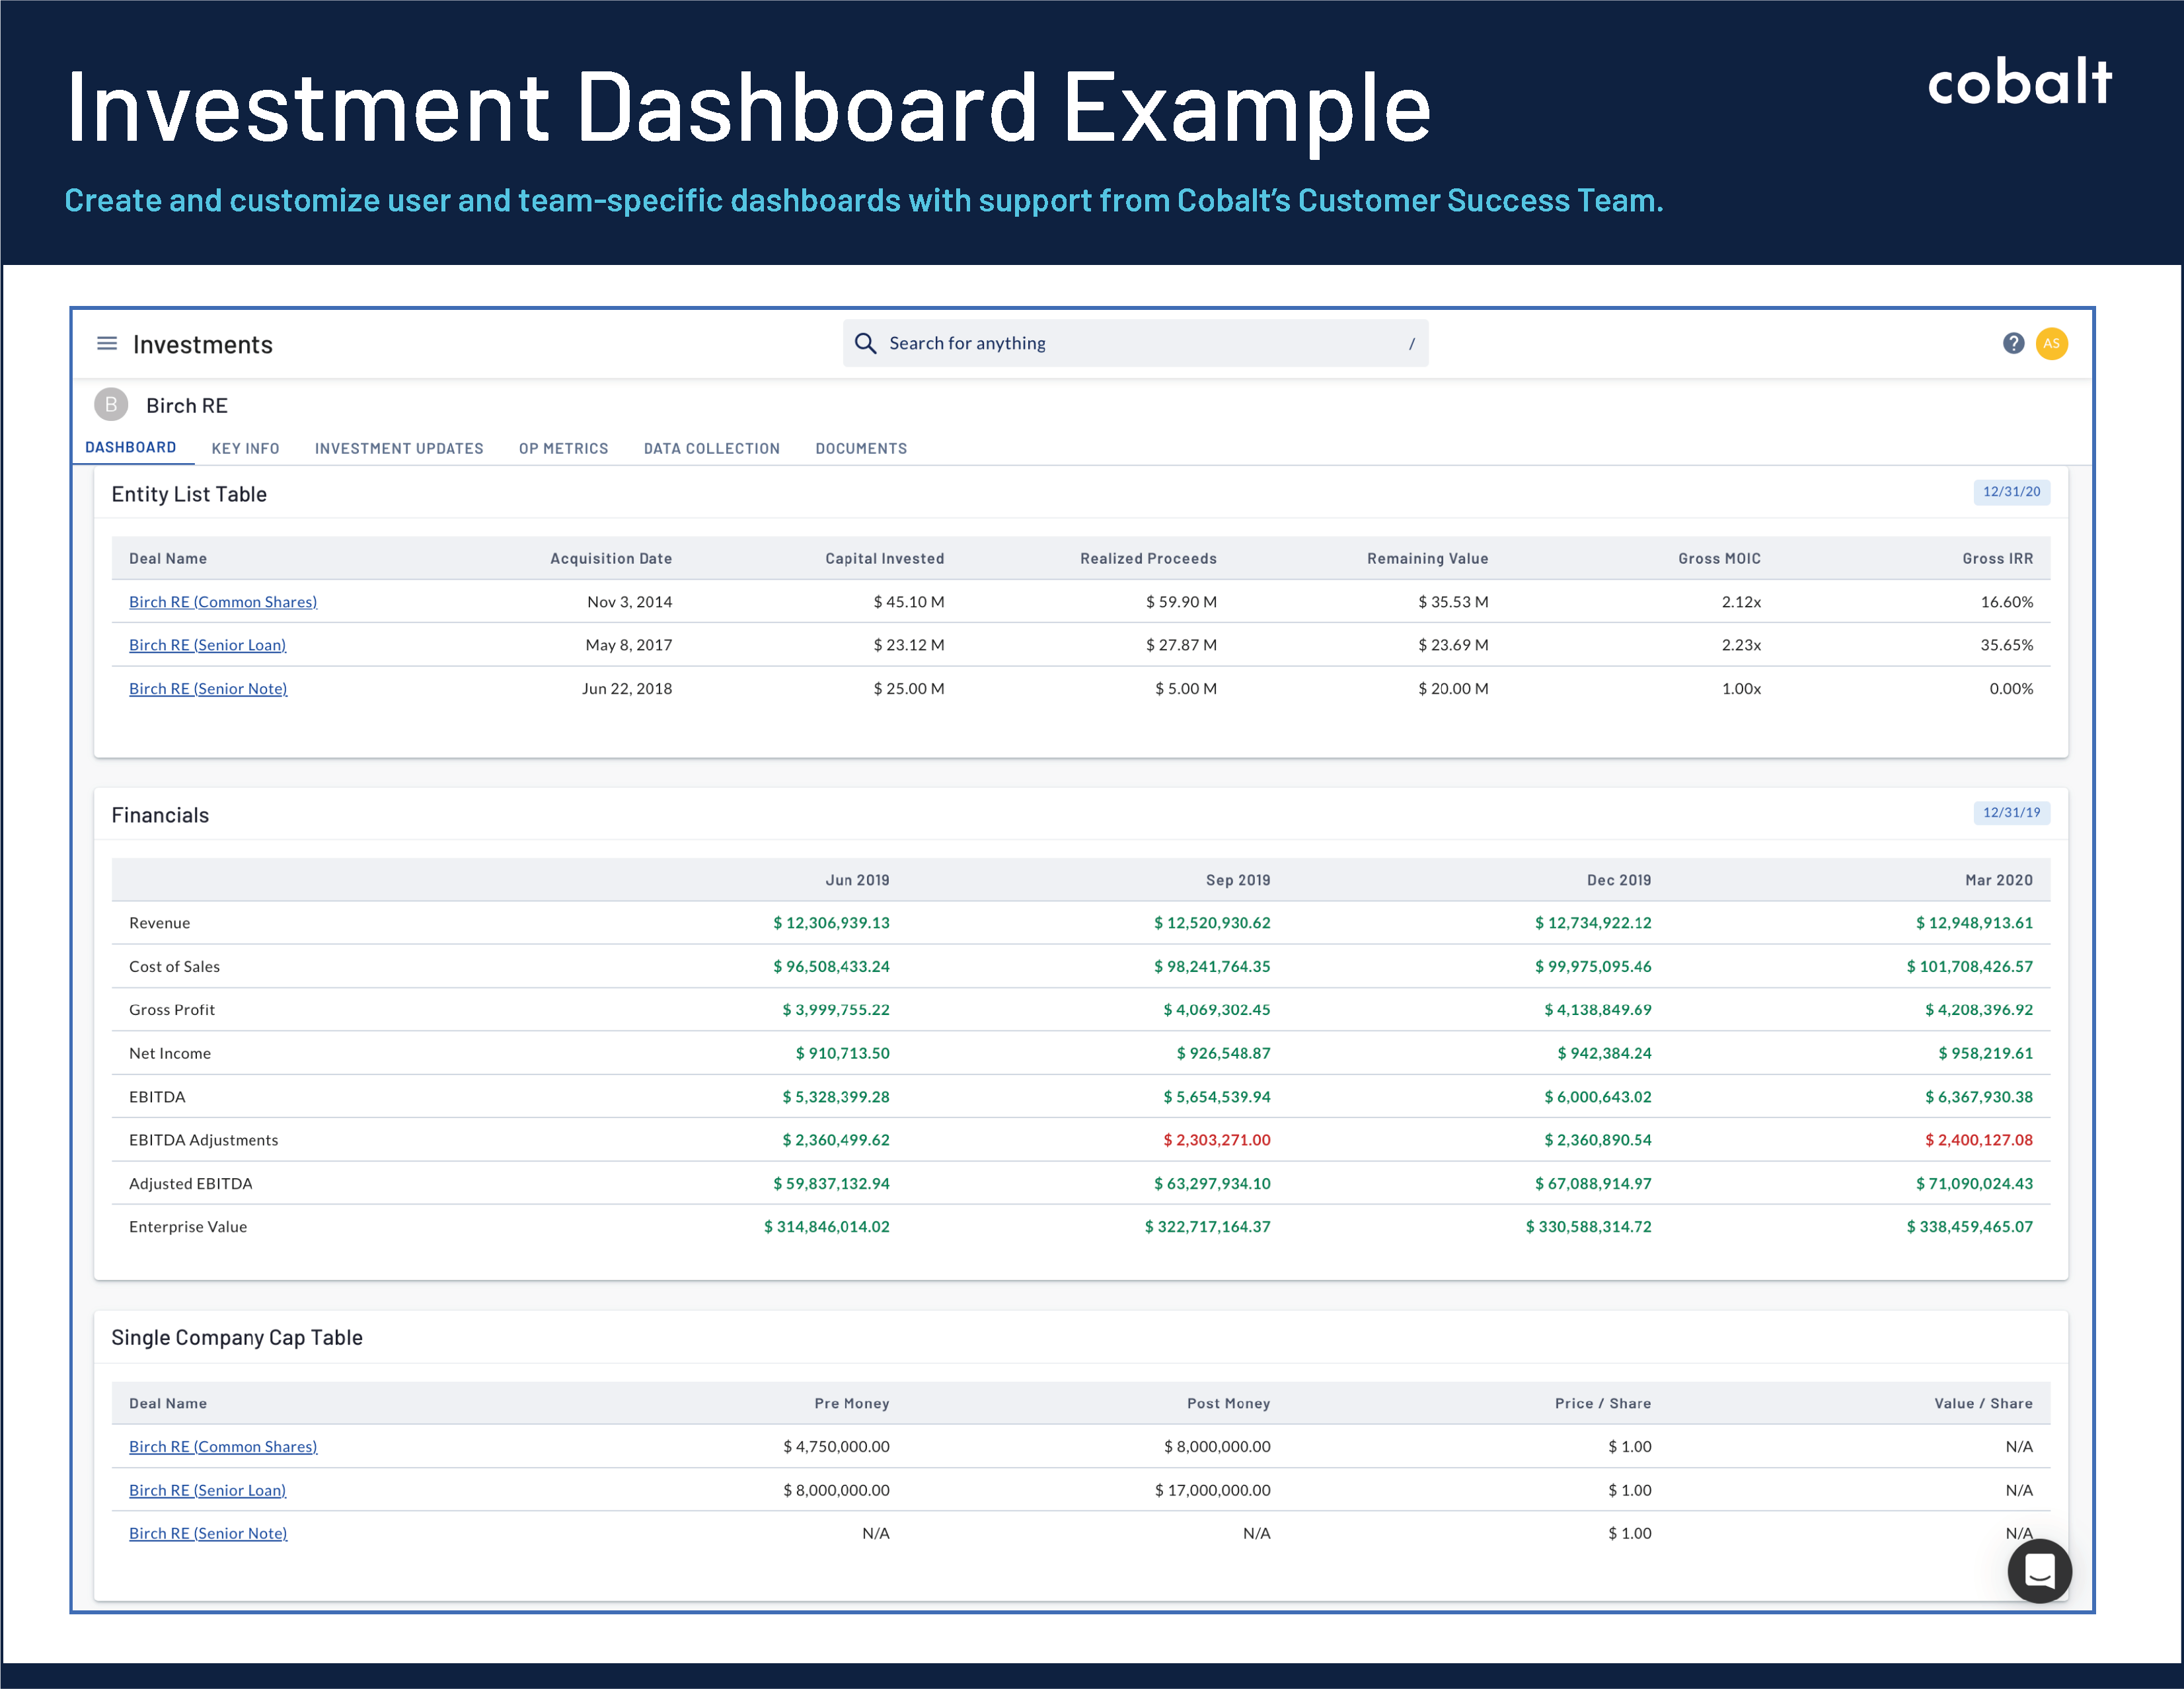
Key elements of our best-practice Investment Dashboard include:
- Entity List including the acquisition date, capital invested, realized proceeds, gross MOIC/IRR, and remaining values for all attached deals. Investors often raise capital in multiple rounds of financing and our entity list allows you to see all rounds (entities) associated with a specific company.
- Single Company Cap Tables show the pre-money, post-money, price / share and value / share for all active deals. The ability to see equity ownership, market capitalization, and market value all in one place allows investors to visualize their equity capital stake in each business as well as streamline shareholder reporting.
- Key Financials such as revenue, cost of sales, gross profit, net income, EBITDA, adjusted EBITDA, and enterprise value. Our graphs and charts make it easier to analyze data on a period to period basis or when comparing a set of key financial metrics. With an abundance of formatting options (e.g. conditional formatting) to choose from, visualizing and identifying trends in your data is made easy.
Cobalt’s Portfolio Monitoring platform gives you the ability to personalize team and user-specific dashboards that are in-sync with the way your firm operates and reports performance. Users can create and customize dashboards on the fly and then easily export to professional, pixel-perfect PDFs that are always partner-ready. Request a demo of Cobalt’s dashboard capabilities today.
Subscribe to our blog:

Is There Geographic Bias in Macro Liquidity Trends in Private Markets?
Is There Geographic Bias in Macro Liquidity Trends in Private Markets? Building on our previous analysis of the role of…

Private Equity Performance: Large Strategies Versus Funds of Funds, Co-Investments, and Secondaries
Private Equity Performance: Large Strategies Versus Funds of Funds, Co-Investments, and Secondaries In private equity, the large strategies of buyouts,…

Examining Tariff Policy Impacts on Private Fund Contribution Rates
Examining Tariff Policy Impacts on Private Fund Contribution Rates Recently we examined the impact of Latin America presidential elections—which carry presumptions…