Chart of the Month: September 2022
Dialed In: Examining Capital Calls Across Varying Market Conditions
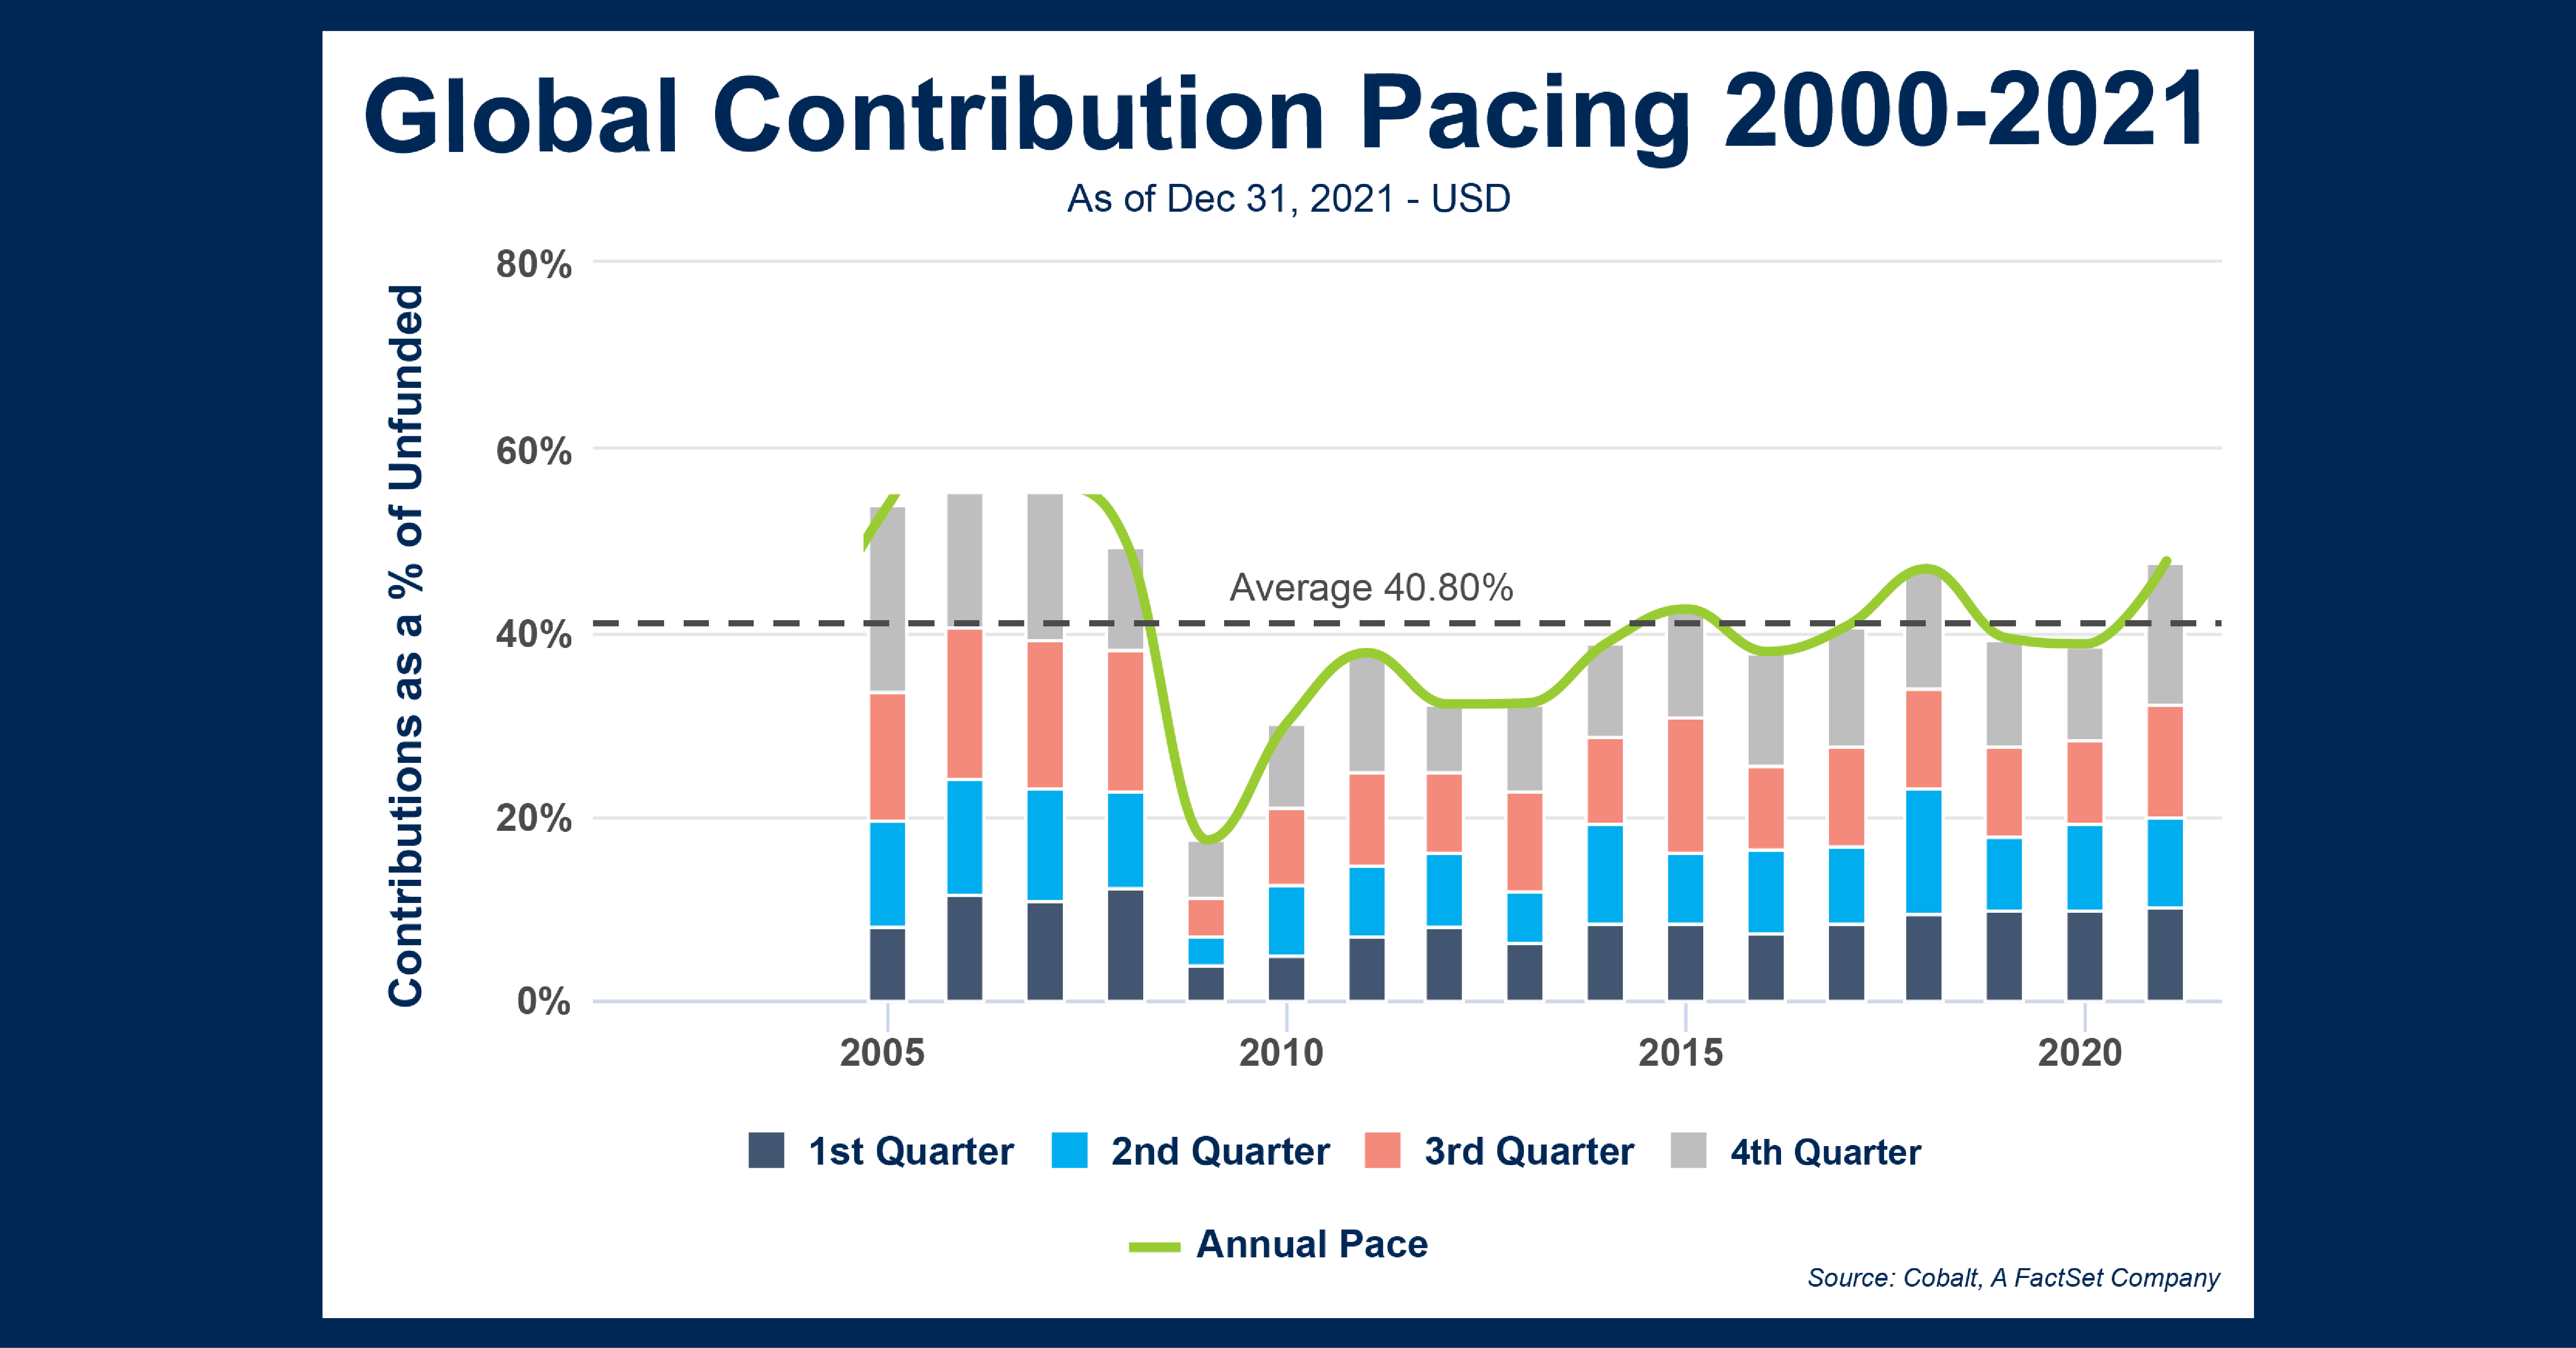
As the United States just experienced its second straight quarter of negative GDP growth (an unofficial marker of a recession by some measures), we wanted to look at how capital calls have ebbed and flowed through the past two decades of both financial downturns and extended growth. This 20-year period offers multiple examples of both, which give us insight into how contributions are affected across a wide array of market conditions. Using the Cobalt Market Dataset, we examined funds across all geographies and investment styles raised from 2000-2021 and looked at their contribution pacing from 2002-present. Contribution pacing in Cobalt is calculated by taking overall contributions to a fund as a % of its unfunded total.
Key Takeaways:
- The longest trend we see above is throughout the 2010’s, where capital calls remained relatively steady with a slight upward trendline. This was in line with other markets, as equities and others experienced uninterrupted growth over the decade. A possible explanation for this decade-long uptick may be connected to the smaller drawdowns seen in the stock market, namely in 2011,2015, and 2018. These could be seen as ‘healthy’ corrections, leaving capital call less susceptible to a halt in activity.
- During the Global Financial Crisis (GFC), an immediate and substantial impact was made on capital calls, with the annual rate dropping to 17% in 2009. The next lowest rate was 30% in 2010, signifying just how steep the impact was in the aftermath of the crisis, as investors tightened the purse strings and remained cautious for multiple quarters at the start of the recovery.
- However, during the COVID crash in 2020, capital calls remained consistent on a quarterly and annual basis, with nearly identical results to the previous year. In fact, 2021 continued the trend of steady growth in pacing, highlighting that capital calls will react differently in overarching economic downturns depending on the differing market conditions.
- Interestingly, when looking at capital calls on a quarterly basis, the average pace increases steadily throughout 2021 from one quarter to the next (8.1% in Q1, 8.8% Q2, 10.6% Q3, 13.2% Q4). Since Cobalt Market Data provides a net-level view, we don’t have insight into deal-level data and flow. However, one possible explanation is that deal activity increased as dealmakers look to wrap up outstanding deals before year-end, causing Q4 to be a bit of a small outlier compared to the other quarters.
Looking Ahead:
- Though there has yet to be a recent fall in contributions pacing, there may be some slowdown expected in the coming quarters as a sustained downtrend has taken hold of the markets. It is possible that the past few quarters of volatility and attrition are more likely to weigh down the activity of capital calls, as opposed to the sudden impact and recovery of COVID in 2020.
- The impact may be less pronounced as well due to another factor, as the decade-long steadiness of contribution pacing seems more sustainable than the overheated run-up we see in the chart from 2002-2008. .
Subscribe to our blog:

Is There Geographic Bias in Macro Liquidity Trends in Private Markets?
Is There Geographic Bias in Macro Liquidity Trends in Private Markets? Building on our previous analysis of the role of…

Private Equity Performance: Large Strategies Versus Funds of Funds, Co-Investments, and Secondaries
Private Equity Performance: Large Strategies Versus Funds of Funds, Co-Investments, and Secondaries In private equity, the large strategies of buyouts,…

Examining Tariff Policy Impacts on Private Fund Contribution Rates
Examining Tariff Policy Impacts on Private Fund Contribution Rates Recently we examined the impact of Latin America presidential elections—which carry presumptions…