Chart of the Month: May 2024
Derivative Charts: Plotting the Growth of the Alternatives Market
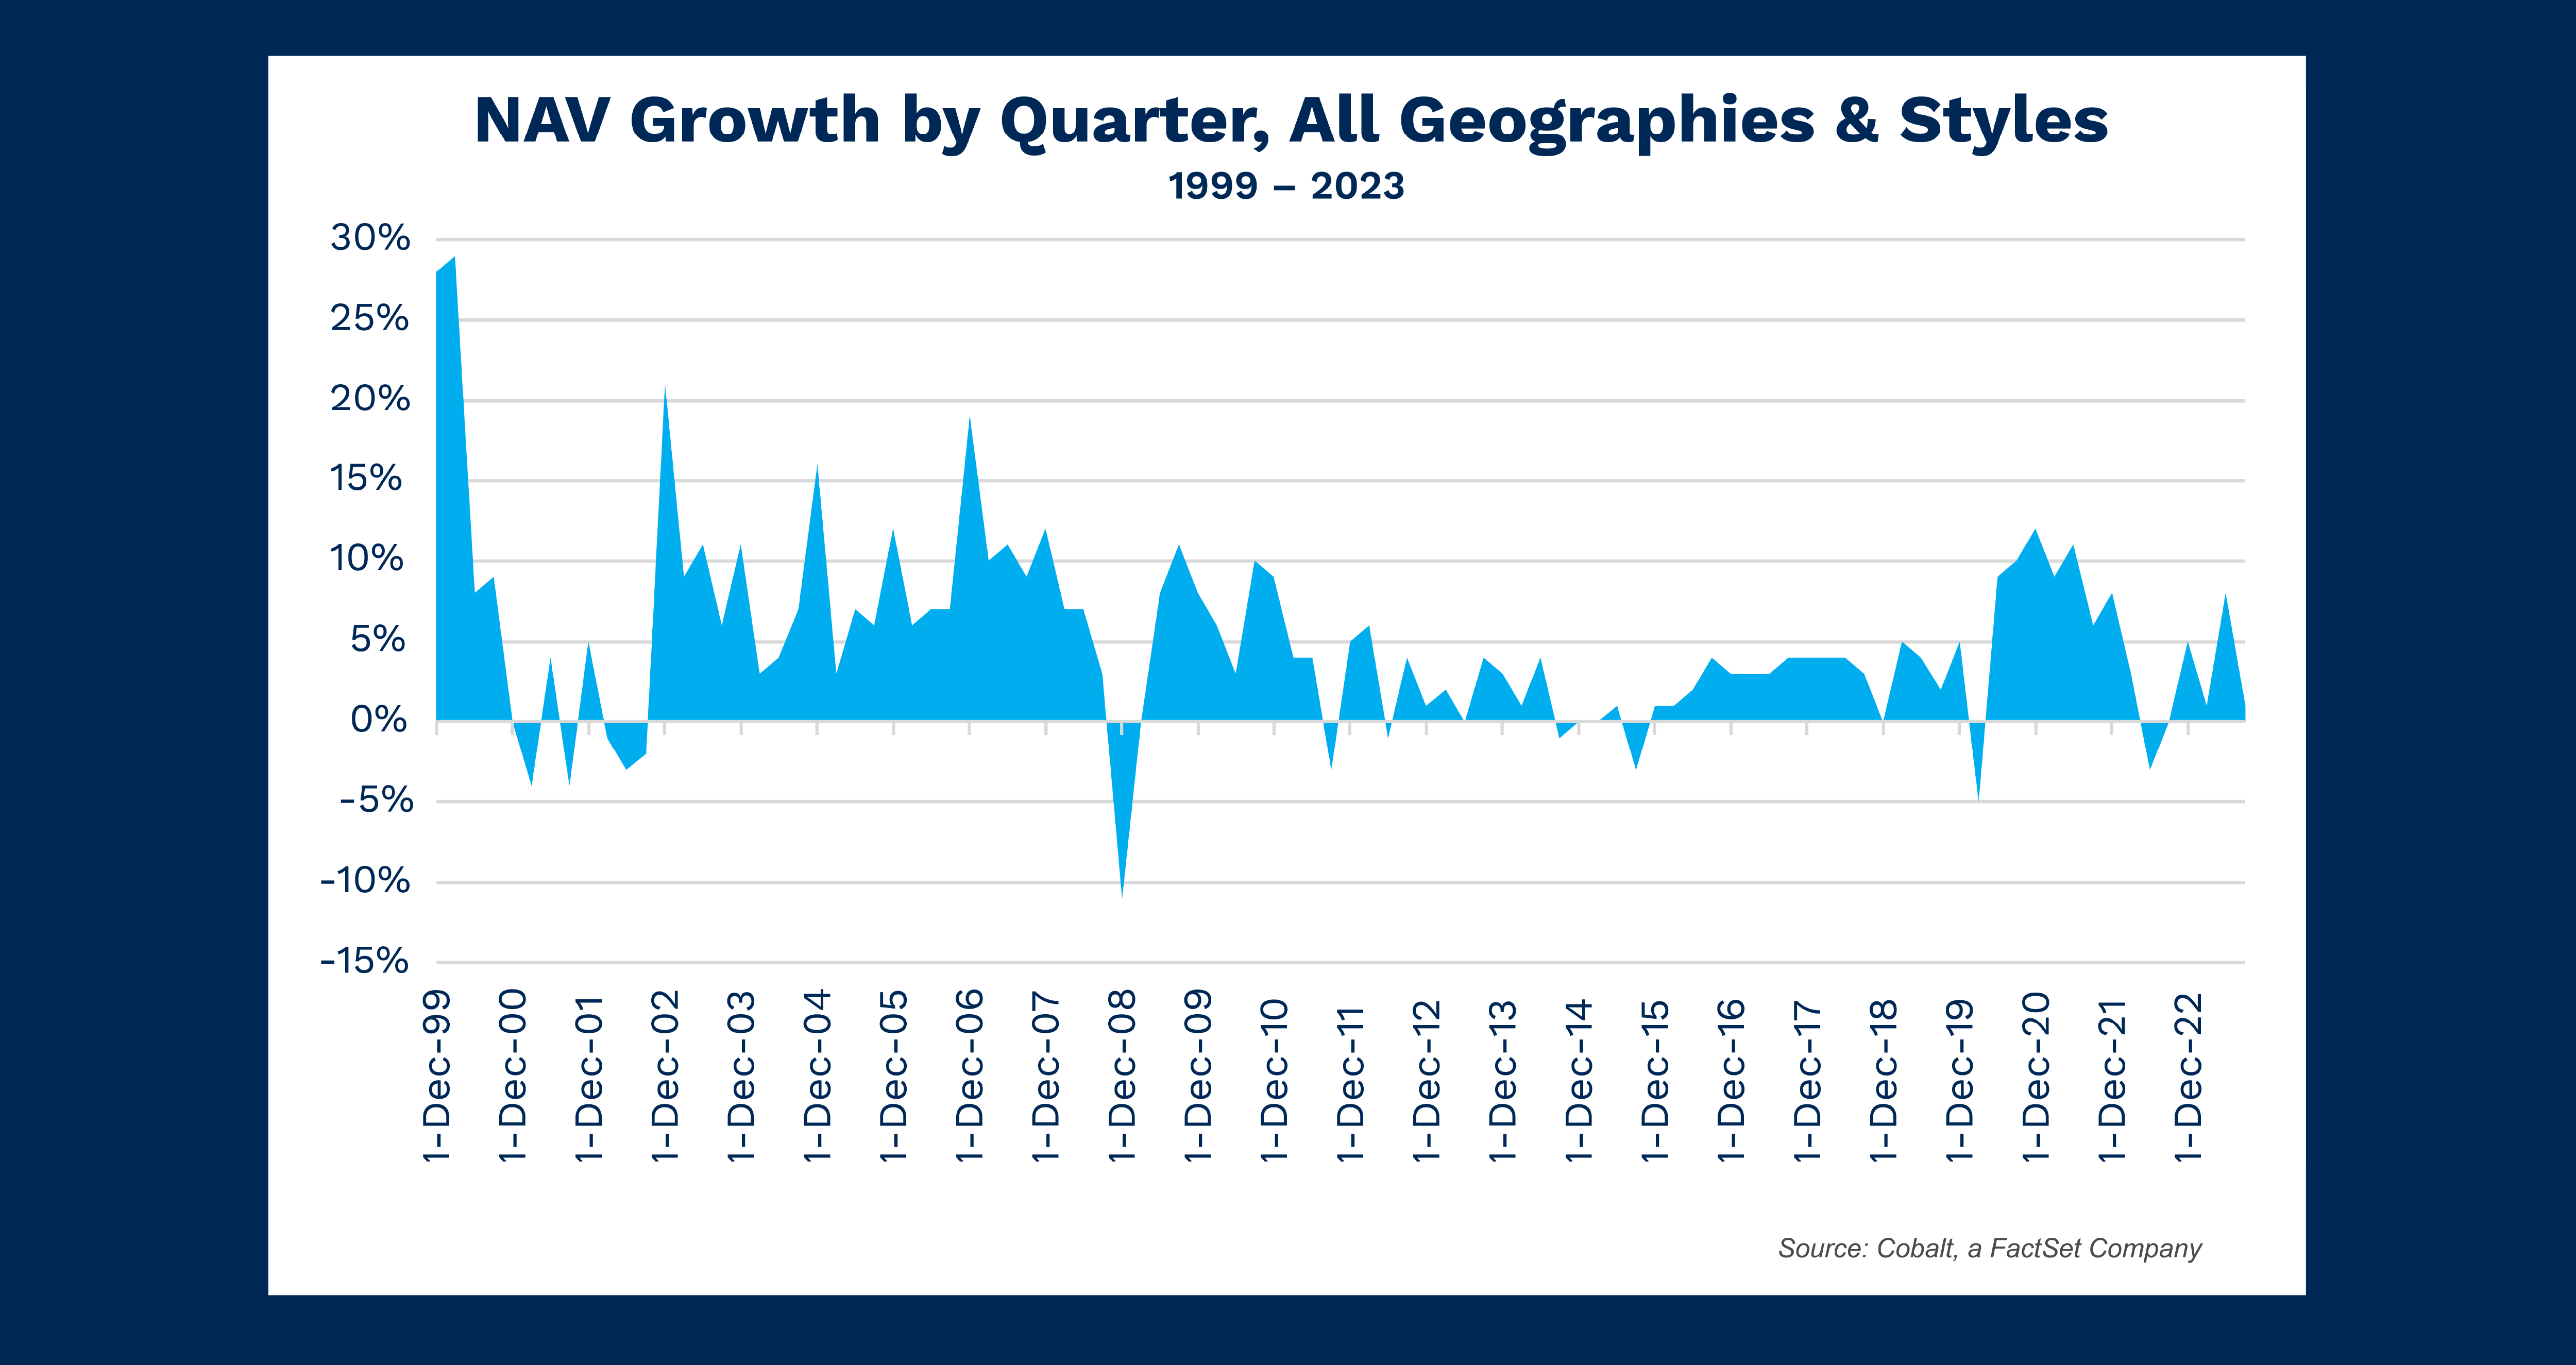
Following up on last month’s chart and the exploration of our off-platform data capabilities, we exported the popular NAV and dry powder chart data to determine the quarter-by-quarter NAV growth of the Global Alternatives market.
Key Takeaways
Though presented in a different manner, our quarterly NAV growth chart tells a similar story to our Cobalt base analytics, with the negative downturns of the early and late 2000s and 2020 prominently displayed. Overall, it is still a growth story: Only 18 of the 96 sample quarters showed zero or negative growth, and the total NAV averaged 5% quarterly growth over the sample period.
The period from Q4 2002 to Q3 2008 is exemplary as the longest stretch of continued quarterly growth. It was a transition period for the private capital industry, when discussing the size of the alternatives market jumped to trillions from billions. Paired with a fruitful climate that led to organic NAV growth between the dot com bubble and the Great Financial Crisis, the half-decade of sustained growth is readily explained.
Naturally, as the market has ballooned to astronomical heights, the peaks of growth seen in the earlier days of our tracked data (near 30% growth in the quarters of the late 90s) are harder to come by. You’ll see that in the chart in the down-and-to-the-right shape of the highest growth quarters over time, with much more needed today to grow a multi-trillion-dollar pie.
Looking Ahead
Barring an impact like that of COVID in Q1 2020, we believe the tightening of growth is likely to continue. This would mean consistent quarters of single-digit growth with the occasional negative quarter.
If LPs continue to reconsider portfolio construction and commit a larger percentage to alternatives, this may act as a buoy for the market to maintain its growth regardless of other macro factors that could prompt a downturn.
Subscribe to our blog:

Is There Geographic Bias in Macro Liquidity Trends in Private Markets?
Is There Geographic Bias in Macro Liquidity Trends in Private Markets? Building on our previous analysis of the role of…

Private Equity Performance: Large Strategies Versus Funds of Funds, Co-Investments, and Secondaries
Private Equity Performance: Large Strategies Versus Funds of Funds, Co-Investments, and Secondaries In private equity, the large strategies of buyouts,…

Examining Tariff Policy Impacts on Private Fund Contribution Rates
Examining Tariff Policy Impacts on Private Fund Contribution Rates Recently we examined the impact of Latin America presidential elections—which carry presumptions…