Cobalt Chart of the Month: December 2020
Cobalt Market Data / Chart of the Month
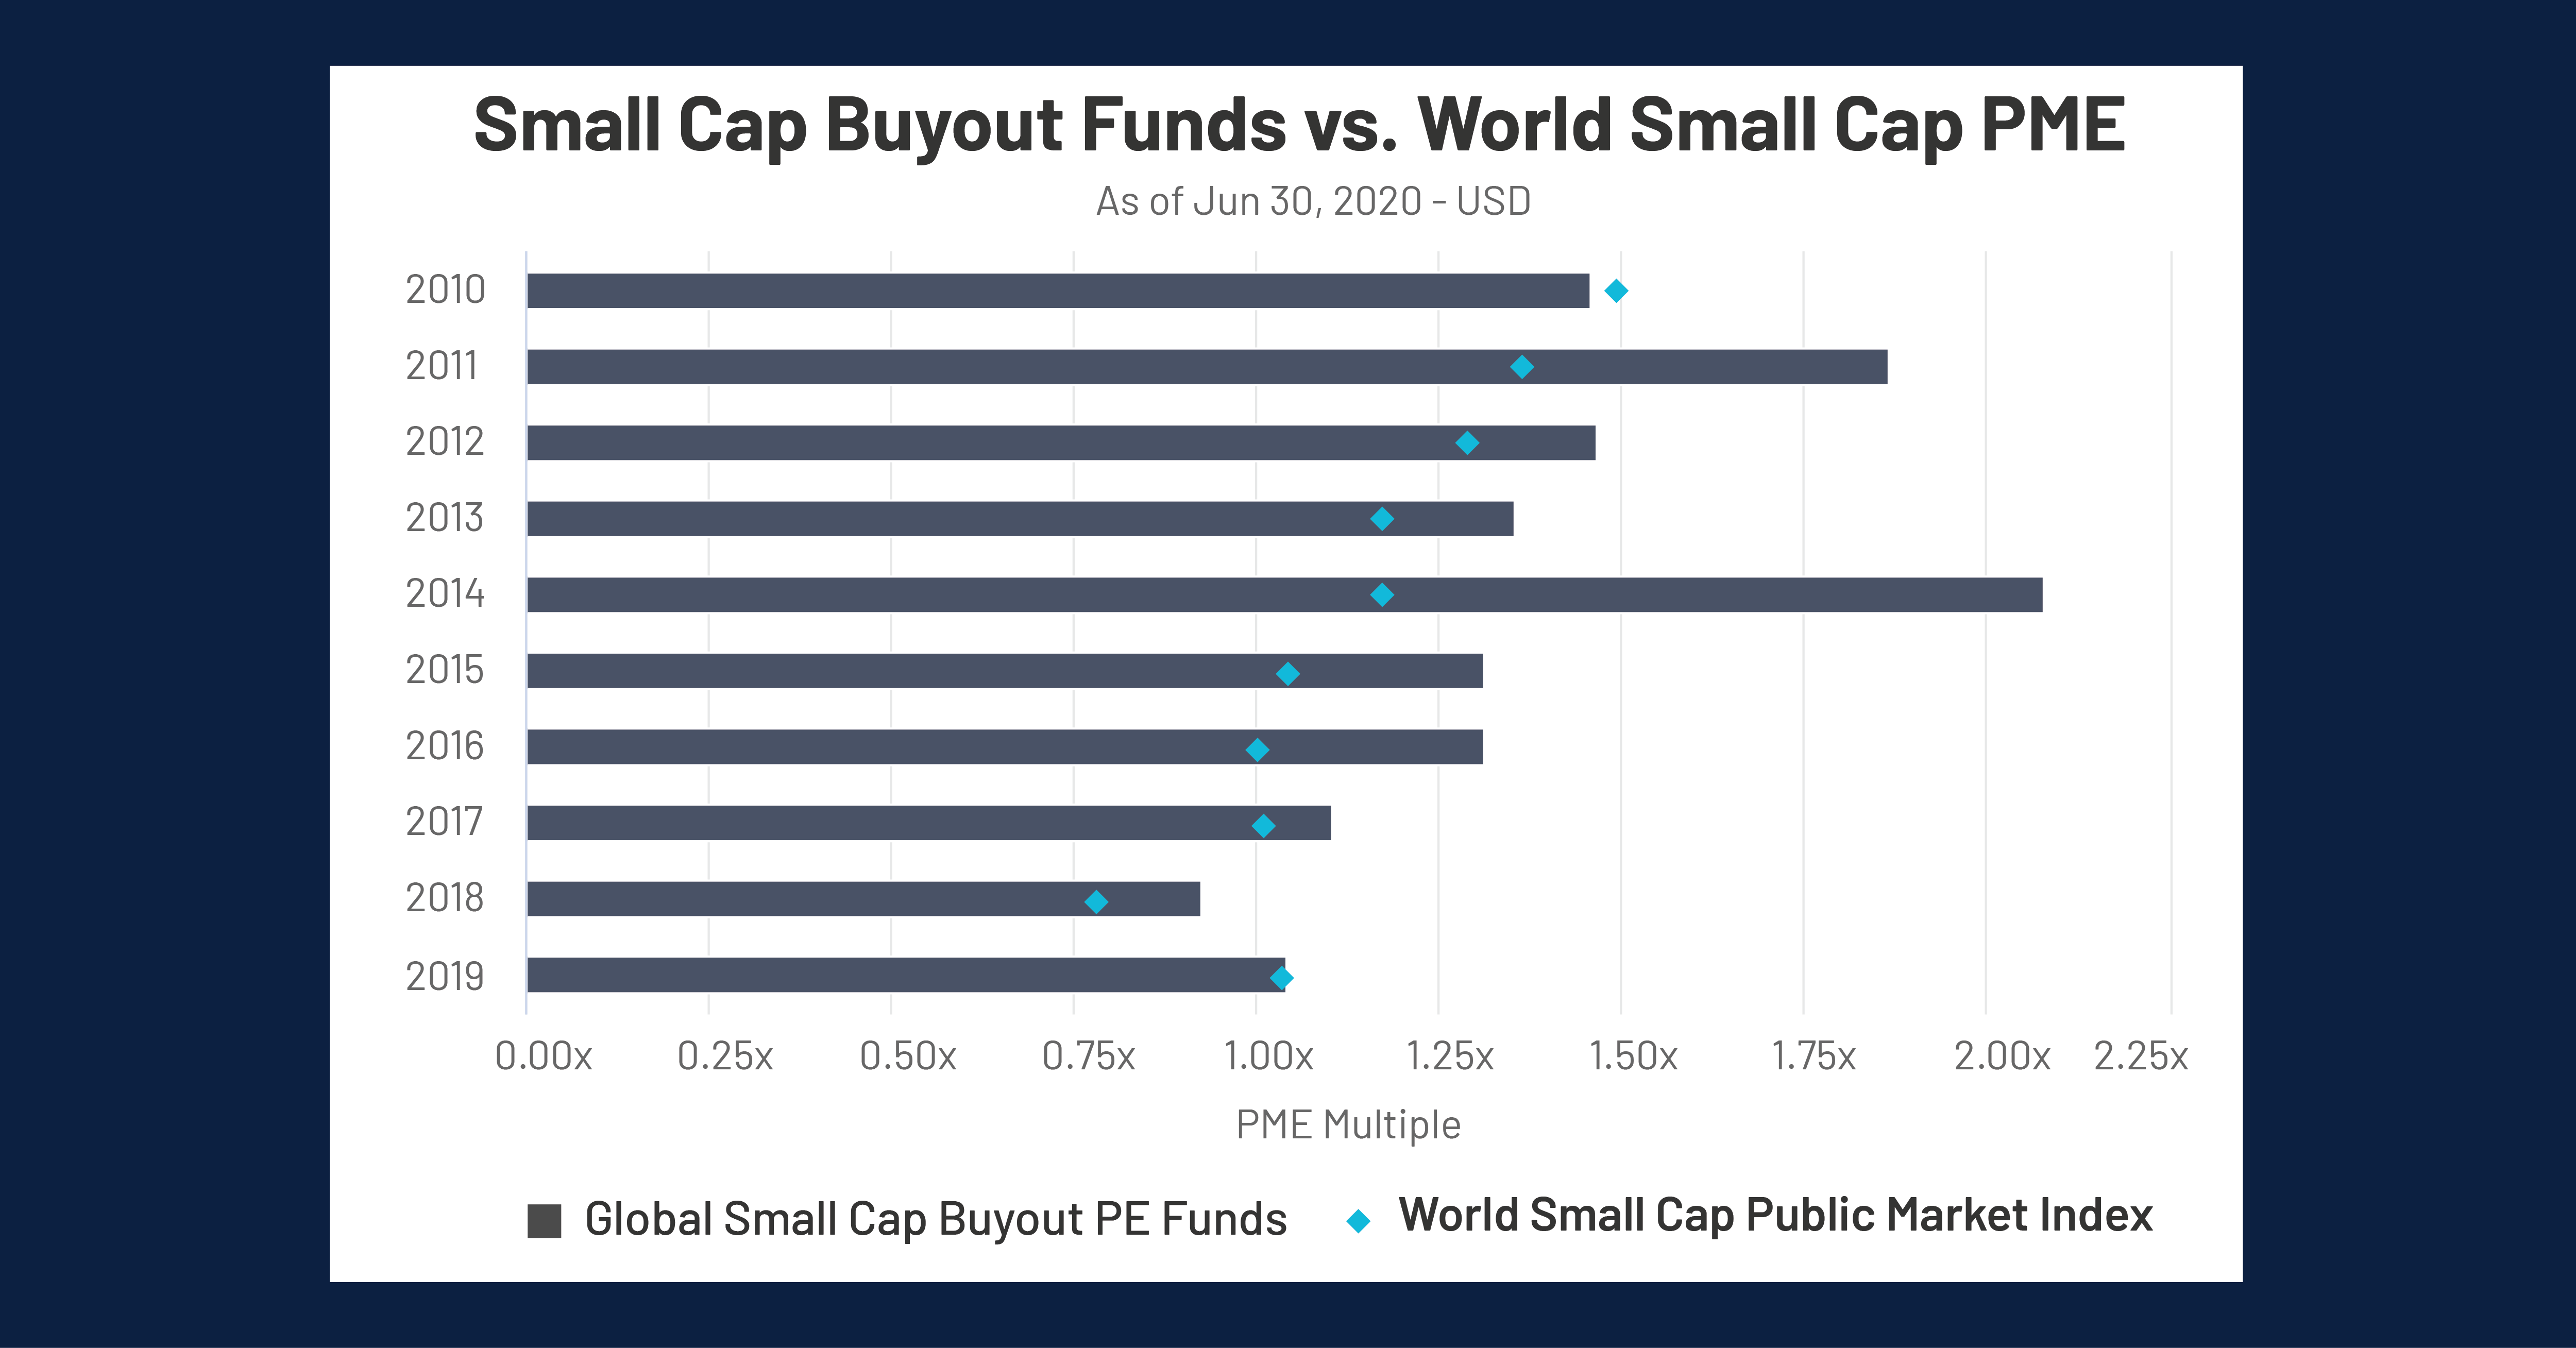
With 2020 coming to a close, we looked at one of the fastest growing investment trends – Special Purpose Acquisition Companies (SPACs) – and its relation to private equity. To do this we analyzed Small Cap Buyout performance, the buyout sector most likely to be on the same playing field as SPACs. The graph below displays the industry average TVPI of Small Cap Buyout Funds from 2010-2019 versus the World Small Cap Public Market Index, and comparing each using PME analysis.
2020 IN REVIEW: SPACS AND SMALL CAP BUYOUT FUNDS
Key Takeaways:
- Small Cap Buyout funds consistently beat the returns of the World Small Cap PME, maintaining a buffer of at least .05x since 2011 up until 2019. PE funds perform well during expansionary economic periods, and can capitalize on recessionary periods, allowing them to access opportunities that can outperform the market at large.
- The PME returns have decreased by an average of .057x each year since 2010, jumping up almost .25x in 2019. Small cap buyout funds have followed the same trends with the exception of 2011 and 2014, which can be partly attributed to the record-breaking funding year of 2007.
- The World Small Cap PME recovered substantially in 2019 from 2018, which was one of the worst years for the world market since 2008. The speedy recovery in 2019 follows the same trend from 2008 – 2009, when the post financial crisis year proved to be one of the strongest periods for economic growth. Because small cap buyout funds take longer to mature and post returns, it’s understandable that rapid economic growth would bolster the public sector before the private market posts the same level of return.
Looking Ahead
- Private Equity firms may witness increasing competition from SPACs in the coming years as their popularity rises with firms eager for an alternative that can offer a faster IPO process under an experienced manager. SPACs also often allow a higher degree of management autonomy in comparison to a buyout firm’s hands-on managing approach, which is more likely to result in a sale rather than a public offering.
- According to Axios, SPACs have raised about $24 billion in 2020, commandeering capital from an average IPO size of about $380 million. Small cap buyout firms have raised approximately $10 billion in funding throughout 2020 with an average fund size of $400-450 million, insinuating that small cap buyout funds and SPACs operate in the same playing field.
- While investors may feel safer with a long-standing small cap buyout firm, larger PE firms such as Altimeter and Oaktree are also sponsoring these blank check organizations. SPACs backed by private equity giants may pose a serious threat to lesser-known small cap buyout firms.
- On the other hand, small cap PE firms may have an incentive to work with SPACs, as the economics of a sale to a SPAC can be very advantageous, such that these buyout funds can potentially sell a portfolio company to a SPAC for a 15% premium of the share price compared to an average sale.
Considerations
- Will the growth of blank check investment organizations undergo continuous growth post COVID, or will their popularity correlate more closely with recessionary periods and opportunistic acquisition environments?
- As small cap funds are generally considered riskier than large cap funds, will the popularity of small cap funds and SPACs inversely correlate with economic prosperity? I.e., will expansionary periods favor small cap buyouts and recessionary periods SPACs?
Subscribe to our blog:

Is There Geographic Bias in Macro Liquidity Trends in Private Markets?
Is There Geographic Bias in Macro Liquidity Trends in Private Markets? Building on our previous analysis of the role of…

Private Equity Performance: Large Strategies Versus Funds of Funds, Co-Investments, and Secondaries
Private Equity Performance: Large Strategies Versus Funds of Funds, Co-Investments, and Secondaries In private equity, the large strategies of buyouts,…

Examining Tariff Policy Impacts on Private Fund Contribution Rates
Examining Tariff Policy Impacts on Private Fund Contribution Rates Recently we examined the impact of Latin America presidential elections—which carry presumptions…