Chart of the Month: August 2023
Alternate Current: Studying the Early Divergence in Energy Market NAV vs. Dry Powder 1995-2022
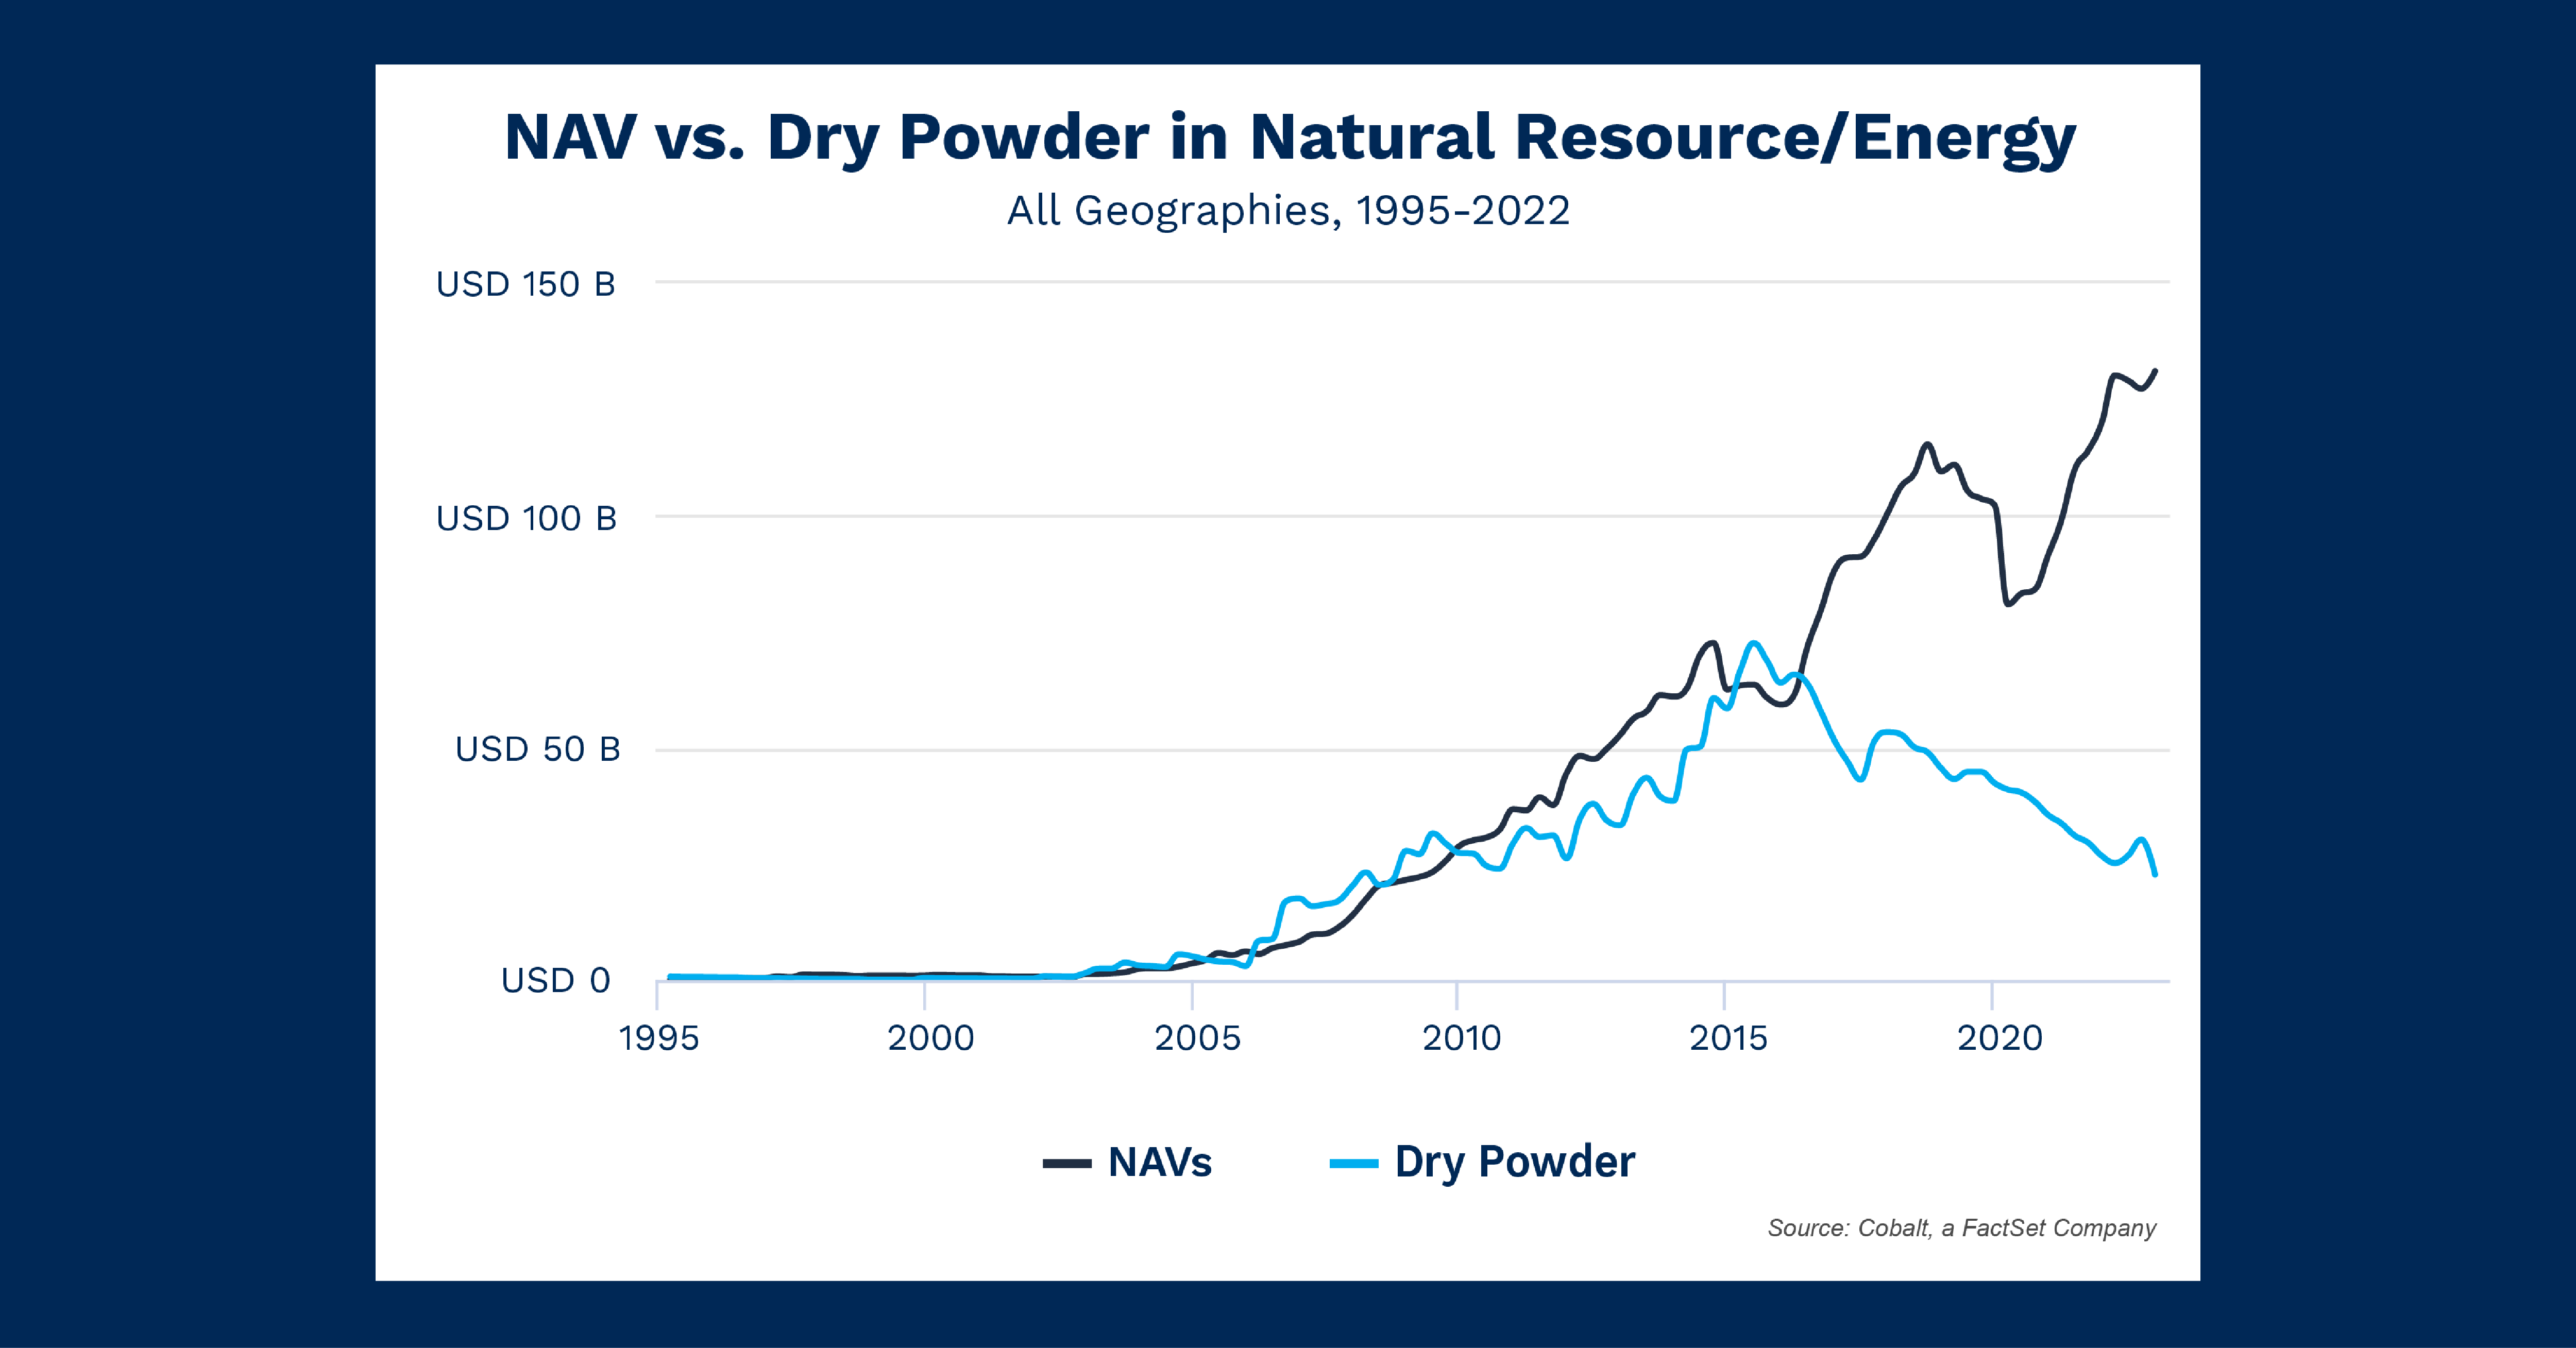
The energy market is consistently prone to violent price swings in reaction to global news. As a result, it’s a difficult style to invest in safely and steadily, despite its ever-growing demand. As follow-up to our June analysis, we‘re looking at more investment styles that deviate from overall trends. As shown in the chart below, Energy varies from other private market trends by splitting the tether between NAV (net asset value) and dry powder at an earlier date and higher rate—more than any other style.
Key Takeaways
Let’s look at the difference in dates. The main market divergences between NAV and dry powder were in 2009 and 2020. These were significant investment inflection points, and in both cases, NAV began to rise beyond dry powder levels as investors spent down the latter to invest into these distressed markets. We can see this reflected in the chart above as well; NAV briefly exceeds dry powder levels from 2010 to 2015 and then accelerated in 2020.
However, between 2015 and 2020, there is a massive rise in NAVs as investors spent down dry powder amid a globally declining energy investment period and historic drops in oil prices. One explanation for the rise was the push for renewable energy sources, such as solar, that began to grow in 2016. In addition, cost-saving measures pushed renewable costs closer to and then below parity with fossil fuels. (Take a look at the Energy Infrastructure Funds raised.) Those opportunities may have attracted the remarkable investment. And as the demand for new or divested energy is constant, so too is the appetite for additional investment in this space. The environment at the time could have signaled investors to go all in and spend down their dry powder.
Looking Ahead
As we alluded, even with the steady march of technological progress, the energy space is subject to strong macro fluctuations. Economic downturns or another pandemic could easily sideline energy demand and pricing in the medium term. Despite the risks and the tribulations of 2020, appetite for this investment style has persisted and strengthened. This gives credence to the sustainability of this wave of investment—as long as dry powder reserves remain.
Subscribe to our blog:

Is There Geographic Bias in Macro Liquidity Trends in Private Markets?
Is There Geographic Bias in Macro Liquidity Trends in Private Markets? Building on our previous analysis of the role of…

Private Equity Performance: Large Strategies Versus Funds of Funds, Co-Investments, and Secondaries
Private Equity Performance: Large Strategies Versus Funds of Funds, Co-Investments, and Secondaries In private equity, the large strategies of buyouts,…

Examining Tariff Policy Impacts on Private Fund Contribution Rates
Examining Tariff Policy Impacts on Private Fund Contribution Rates Recently we examined the impact of Latin America presidential elections—which carry presumptions…