Cobalt Chart of the Month: July 2020
Cobalt Market Data Chart of the Month
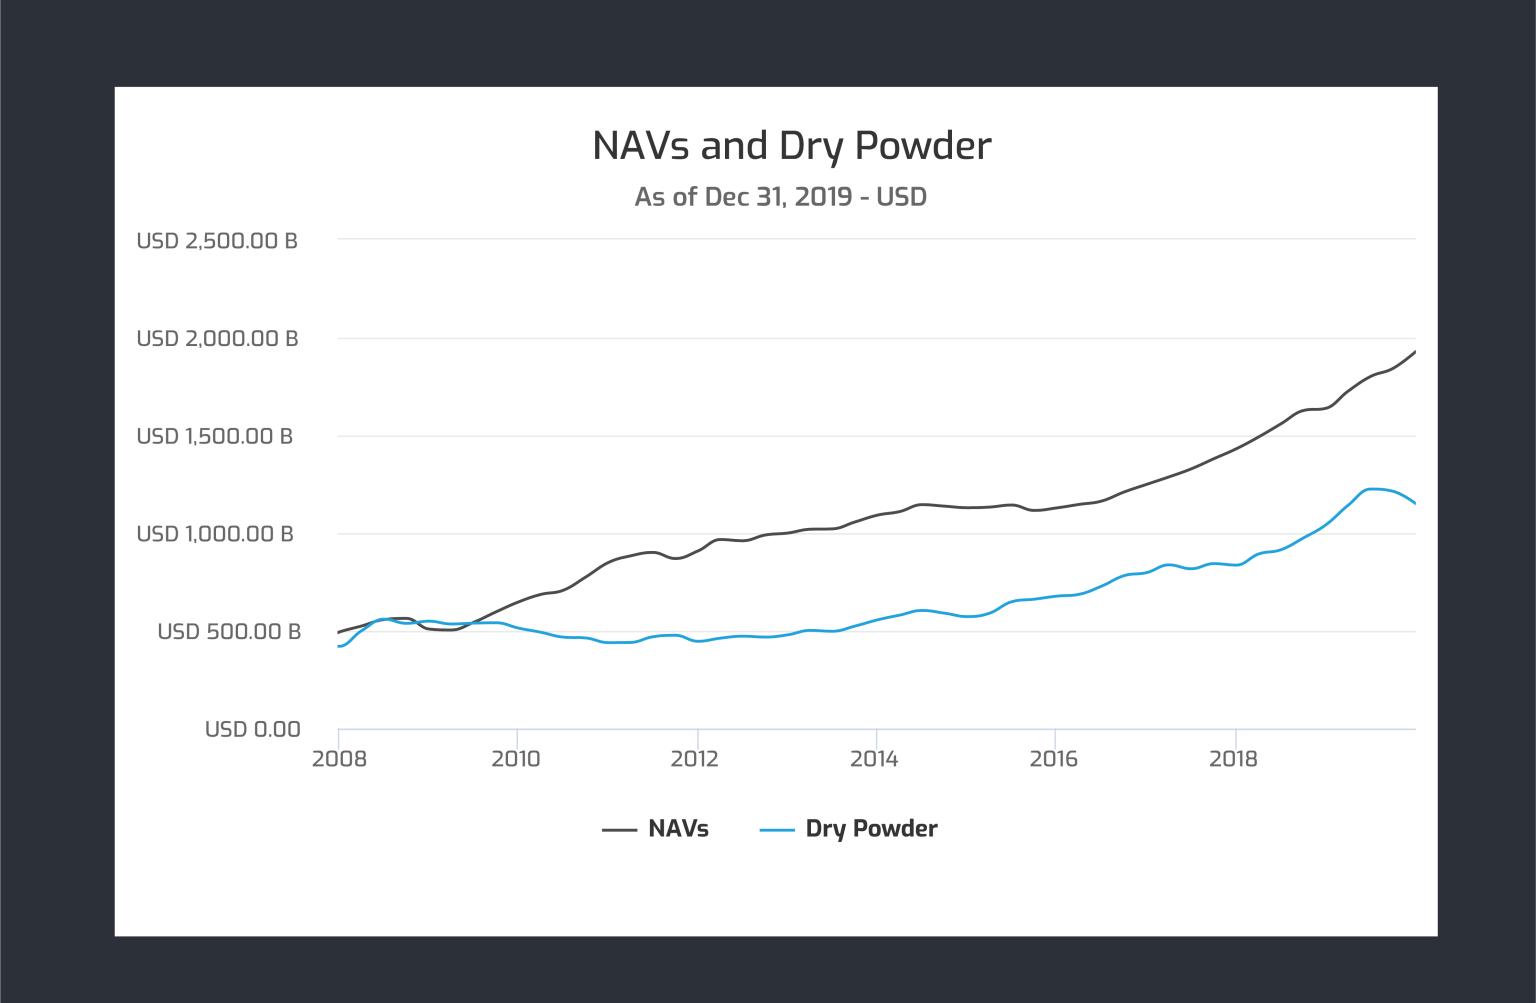
NAVs and Dry Powder in the 2010’s
This chart indicates that from 2012 to 2018, in the recovery following the 2008 recession, dry powder and NAVs had seen a fairly parallel growth. However, dry powder plateaued at the end of 2018 and remained flat throughout 2019. Meanwhile, NAVs have continued to climb.
Key Takeaways:
- If these two key metrics continue to separate, more money will likely be deployed in attractive deals in a down market, similar to what we saw post-2008 when NAVs began to separate from dry powder.
- Climbing NAVs are indicative of growing holding periods and asset prices in funds over the past decade
- If dry powder continues to plateau, this could shorten deployment cycles, or it’s potentially a signal that the amount of deals in the market are moving roughly in line with new commitments being made from LPs.
Looking Ahead:
- Will we see NAVs continue to outpace dry powder in the near future, similar to the post-2008 landscape?
- What does this trend mean for the market heading into the COVID crash of early 2020?
- Will a less frothy market heading into the downturn blunt the impact on the PE market?
Subscribe to our blog:

Is There Geographic Bias in Macro Liquidity Trends in Private Markets?
Is There Geographic Bias in Macro Liquidity Trends in Private Markets? Building on our previous analysis of the role of…

Private Equity Performance: Large Strategies Versus Funds of Funds, Co-Investments, and Secondaries
Private Equity Performance: Large Strategies Versus Funds of Funds, Co-Investments, and Secondaries In private equity, the large strategies of buyouts,…

Examining Tariff Policy Impacts on Private Fund Contribution Rates
Examining Tariff Policy Impacts on Private Fund Contribution Rates Recently we examined the impact of Latin America presidential elections—which carry presumptions…